Aleut vs Immigrants from Guyana Associate's Degree

COMPARE

Aleut
Race
Ancestry
AfghanAfricanAlaska NativeAlaskan AthabascanAlbanianAleutAlsatianAmericanApacheArabArapahoArgentineanArmenianAssyrian/Chaldean/SyriacAustralianAustrianBahamianBangladeshiBarbadianBasqueBelgianBelizeanBermudanBhutaneseBlackfeetBolivianBrazilianBritishBritish West IndianBulgarianBurmeseCajunCambodianCanadianCape VerdeanCarpatho RusynCelticCentral AmericanCentral American IndianCherokeeCheyenneChickasawChileanChineseChippewaChoctawColombianColvilleComancheCosta RicanCreeCreekCroatianCrowCubanCypriotCzechCzechoslovakianDanishDelawareDominicanDutchDutch West IndianEastern EuropeanEcuadorianEgyptianEnglishEstonianEthiopianEuropeanFijianFilipinoFinnishFrenchFrench American IndianFrench CanadianGermanGerman RussianGhanaianGreekGuamanian/ChamorroGuatemalanGuyaneseHaitianHmongHonduranHopiHoumaHungarianIcelanderIndian (Asian)IndonesianInupiatIranianIraqiIrishIroquoisIsraeliItalianJamaicanJapaneseJordanianKenyanKiowaKoreanLaotianLatvianLebaneseLiberianLithuanianLumbeeLuxembourgerMacedonianMalaysianMalteseMarshalleseMenomineeMexicanMexican American IndianMongolianMoroccanNative HawaiianNavajoNepaleseNew ZealanderNicaraguanNigerianNorthern EuropeanNorwegianOkinawanOsageOttawaPaiutePakistaniPalestinianPanamanianParaguayanPennsylvania GermanPeruvianPimaPolishPortuguesePotawatomiPuebloPuerto RicanPuget Sound SalishRomanianRussianSalvadoranSamoanScandinavianScotch-IrishScottishSeminoleSenegaleseSerbianShoshoneSierra LeoneanSiouxSlavicSlovakSloveneSomaliSouth AfricanSouth AmericanSouth American IndianSoviet UnionSpaniardSpanishSpanish AmericanSpanish American IndianSri LankanSubsaharan AfricanSudaneseSwedishSwissSyrianTaiwaneseThaiTlingit-HaidaTohono O'OdhamTonganTrinidadian and TobagonianTsimshianTurkishU.S. Virgin IslanderUgandanUkrainianUruguayanUteVenezuelanVietnameseWelshWest IndianYakamaYaquiYugoslavianYumanYup'ikZimbabwean
Immigration
NonimmigrantsImmigrantsAfghanistanAfricaAlbaniaArgentinaArmeniaAsiaAustraliaAustriaBahamasBangladeshBarbadosBelarusBelgiumBelizeBoliviaBosnia and HerzegovinaBrazilBulgariaBurma/MyanmarCabo VerdeCambodiaCameroonCanadaCaribbeanCentral AmericaChileChinaColombiaCongoCosta RicaCroatiaCubaCzechoslovakiaDenmarkDominicaDominican RepublicEastern AfricaEastern AsiaEastern EuropeEcuadorEgyptEl SalvadorEnglandEritreaEthiopiaEuropeFijiFranceGermanyGhanaGreeceGrenadaGuatemalaHaitiHondurasHong KongHungaryIndiaIndonesiaIranIraqIrelandIsraelItalyJamaicaJapanJordanKazakhstanKenyaKoreaKuwaitLaosLatin AmericaLatviaLebanonLiberiaLithuaniaMalaysiaMexicoMicronesiaMiddle AfricaMoldovaMoroccoNepalNetherlandsNicaraguaNigeriaNorth AmericaNorth MacedoniaNorthern AfricaNorthern EuropeNorwayOceaniaPakistanPanamaPeruPhilippinesPolandPortugalRomaniaRussiaSaudi ArabiaScotlandSenegalSerbiaSierra LeoneSingaporeSomaliaSouth AfricaSouth AmericaSouth Central AsiaSouth Eastern AsiaSouthern EuropeSpainSri LankaSt. Vincent and the GrenadinesSudanSwedenSwitzerlandSyriaTaiwanThailandTrinidad and TobagoTurkeyUgandaUkraineUruguayUzbekistanVenezuelaVietnamWest IndiesWestern AfricaWestern AsiaWestern EuropeYemenZaireZimbabweAzores
Immigrants from Guyana
Race
Ancestry
AfghanAfricanAlaska NativeAlaskan AthabascanAlbanianAlsatianAmericanApacheArabArapahoArgentineanArmenianAssyrian/Chaldean/SyriacAustralianAustrianBahamianBangladeshiBarbadianBasqueBelgianBelizeanBermudanBhutaneseBlackfeetBolivianBrazilianBritishBritish West IndianBulgarianBurmeseCajunCambodianCanadianCape VerdeanCarpatho RusynCelticCentral AmericanCentral American IndianCherokeeCheyenneChickasawChileanChineseChippewaChoctawColombianColvilleComancheCosta RicanCreeCreekCroatianCrowCubanCypriotCzechCzechoslovakianDanishDelawareDominicanDutchDutch West IndianEastern EuropeanEcuadorianEgyptianEnglishEstonianEthiopianEuropeanFijianFilipinoFinnishFrenchFrench American IndianFrench CanadianGermanGerman RussianGhanaianGreekGuamanian/ChamorroGuatemalanGuyaneseHaitianHmongHonduranHopiHoumaHungarianIcelanderIndian (Asian)IndonesianInupiatIranianIraqiIrishIroquoisIsraeliItalianJamaicanJapaneseJordanianKenyanKiowaKoreanLaotianLatvianLebaneseLiberianLithuanianLumbeeLuxembourgerMacedonianMalaysianMalteseMarshalleseMenomineeMexicanMexican American IndianMongolianMoroccanNative HawaiianNavajoNepaleseNew ZealanderNicaraguanNigerianNorthern EuropeanNorwegianOkinawanOsageOttawaPaiutePakistaniPalestinianPanamanianParaguayanPennsylvania GermanPeruvianPimaPolishPortuguesePotawatomiPuebloPuerto RicanPuget Sound SalishRomanianRussianSalvadoranSamoanScandinavianScotch-IrishScottishSeminoleSenegaleseSerbianShoshoneSierra LeoneanSiouxSlavicSlovakSloveneSomaliSouth AfricanSouth AmericanSouth American IndianSoviet UnionSpaniardSpanishSpanish AmericanSpanish American IndianSri LankanSubsaharan AfricanSudaneseSwedishSwissSyrianTaiwaneseThaiTlingit-HaidaTohono O'OdhamTonganTrinidadian and TobagonianTsimshianTurkishU.S. Virgin IslanderUgandanUkrainianUruguayanUteVenezuelanVietnameseWelshWest IndianYakamaYaquiYugoslavianYumanYup'ikZimbabwean
Immigration
NonimmigrantsImmigrantsAfghanistanAfricaAlbaniaArgentinaArmeniaAsiaAustraliaAustriaBahamasBangladeshBarbadosBelarusBelgiumBelizeBoliviaBosnia and HerzegovinaBrazilBulgariaBurma/MyanmarCabo VerdeCambodiaCameroonCanadaCaribbeanCentral AmericaChileChinaColombiaCongoCosta RicaCroatiaCubaCzechoslovakiaDenmarkDominicaDominican RepublicEastern AfricaEastern AsiaEastern EuropeEcuadorEgyptEl SalvadorEnglandEritreaEthiopiaEuropeFijiFranceGermanyGhanaGreeceGrenadaGuatemalaGuyanaHaitiHondurasHong KongHungaryIndiaIndonesiaIranIraqIrelandIsraelItalyJamaicaJapanJordanKazakhstanKenyaKoreaKuwaitLaosLatin AmericaLatviaLebanonLiberiaLithuaniaMalaysiaMexicoMicronesiaMiddle AfricaMoldovaMoroccoNepalNetherlandsNicaraguaNigeriaNorth AmericaNorth MacedoniaNorthern AfricaNorthern EuropeNorwayOceaniaPakistanPanamaPeruPhilippinesPolandPortugalRomaniaRussiaSaudi ArabiaScotlandSenegalSerbiaSierra LeoneSingaporeSomaliaSouth AfricaSouth AmericaSouth Central AsiaSouth Eastern AsiaSouthern EuropeSpainSri LankaSt. Vincent and the GrenadinesSudanSwedenSwitzerlandSyriaTaiwanThailandTrinidad and TobagoTurkeyUgandaUkraineUruguayUzbekistanVenezuelaVietnamWest IndiesWestern AfricaWestern AsiaWestern EuropeYemenZaireZimbabweAzores
Associate's Degree
Income
Poverty
Unemployment
Labor Participation
Family Structure
Vehicle Availability
Education Level
Disability

Associate's Degree Comparison

Aleuts

Immigrants from Guyana

Tragic
Tragic
39.6%
ASSOCIATE'S DEGREE
0.0/ 100
METRIC RATING
287th/ 347
METRIC RANK
41.8%
ASSOCIATE'S DEGREE
0.5/ 100
METRIC RATING
255th/ 347
METRIC RANK

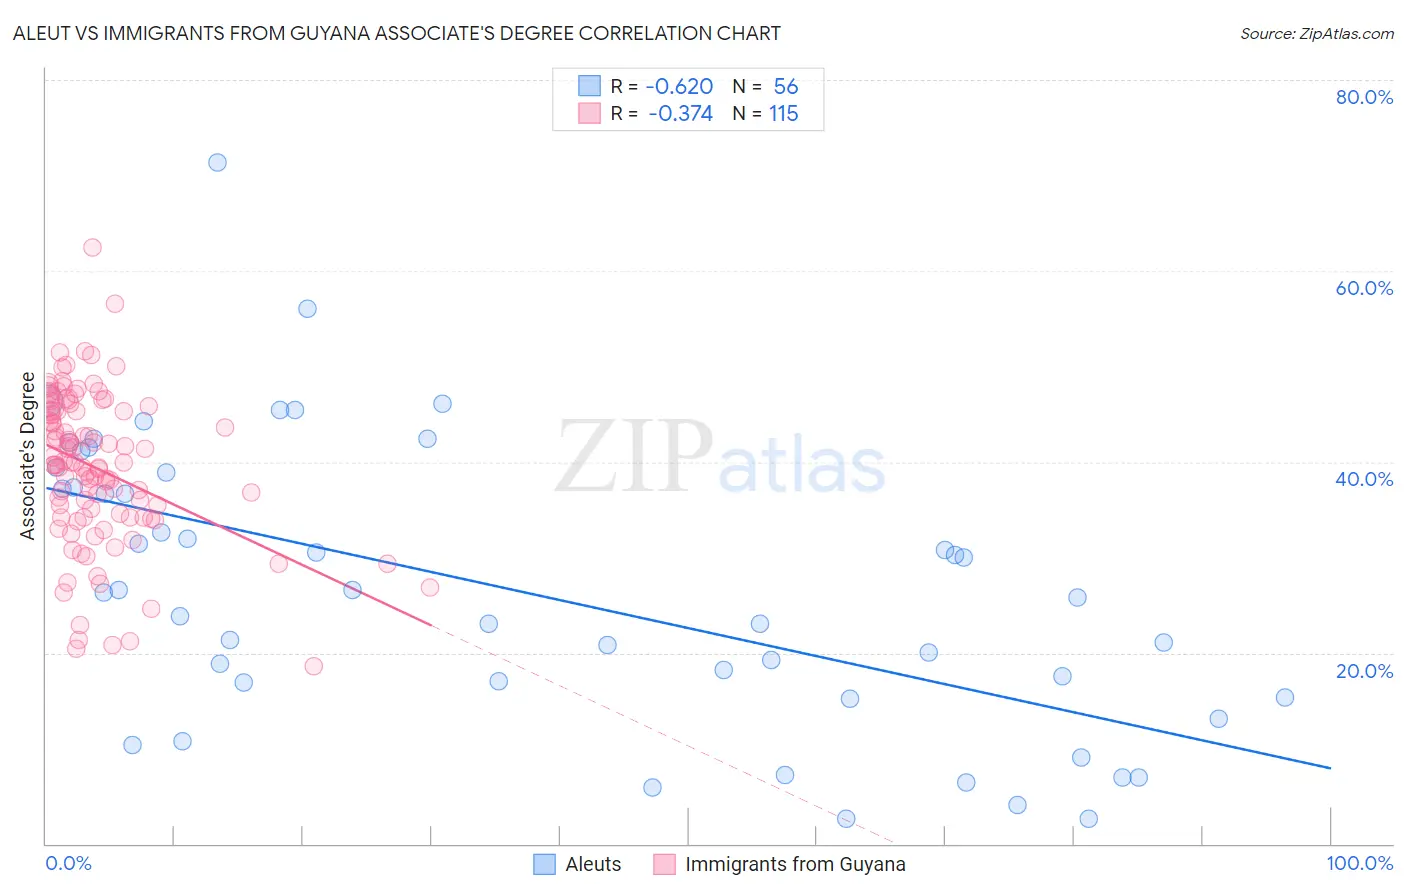
Aleut vs Immigrants from Guyana Associate's Degree Correlation Chart

The statistical analysis conducted on geographies consisting of 61,782,803 people shows a significant negative correlation between the proportion of Aleuts and percentage of population with at least associate's degree education in the United States with a correlation coefficient (R) of -0.620 and weighted average of 39.6%. Similarly, the statistical analysis conducted on geographies consisting of 183,738,689 people shows a mild negative correlation between the proportion of Immigrants from Guyana and percentage of population with at least associate's degree education in the United States with a correlation coefficient (R) of -0.374 and weighted average of 41.8%, a difference of 5.6%.
Aleut vs Immigrants from Guyana Associate's Degree

Associate's Degree Correlation Summary

MeasurementAleutImmigrants from Guyana
Minimum2.6%18.6%
Maximum71.3%62.4%
Range68.7%43.8%
Mean26.6%39.3%
Median26.0%39.7%
Interquartile 25% (IQ1)16.1%34.1%
Interquartile 75% (IQ3)38.1%45.3%
Interquartile Range (IQR)22.0%11.2%
Standard Deviation (Sample)14.9%8.0%
Standard Deviation (Population)14.8%8.0%

Similar Demographics by Associate's Degree

Demographics Similar to Aleuts by Associate's Degree

In terms of associate's degree, the demographic groups most similar to Aleuts are Immigrants from Cuba (39.5%, a difference of 0.24%), Immigrants from Caribbean (39.7%, a difference of 0.26%), Central American (39.4%, a difference of 0.50%), Immigrants from Belize (39.9%, a difference of 0.60%), and Comanche (39.9%, a difference of 0.70%).
DemographicsRating | RankAssociate's Degree
Immigrants | Micronesia
0.1
/100
|
#280
Tragic
40.2%
Immigrants | Portugal
0.1
/100
|
#281
Tragic
40.1%
Bangladeshis
0.1
/100
|
#282
Tragic
40.0%
Haitians
0.1
/100
|
#283
Tragic
40.0%
Comanche
0.1
/100
|
#284
Tragic
39.9%
Immigrants | Belize
0.1
/100
|
#285
Tragic
39.9%
Immigrants | Caribbean
0.0
/100
|
#286
Tragic
39.7%
Aleuts
0.0
/100
|
#287
Tragic
39.6%
Immigrants | Cuba
0.0
/100
|
#288
Tragic
39.5%
Central Americans
0.0
/100
|
#289
Tragic
39.4%
Immigrants | Haiti
0.0
/100
|
#290
Tragic
39.3%
Dominicans
0.0
/100
|
#291
Tragic
39.3%
Blacks/African Americans
0.0
/100
|
#292
Tragic
39.1%
Nepalese
0.0
/100
|
#293
Tragic
39.0%
Salvadorans
0.0
/100
|
#294
Tragic
39.0%

Demographics Similar to Immigrants from Guyana by Associate's Degree

In terms of associate's degree, the demographic groups most similar to Immigrants from Guyana are Cuban (41.9%, a difference of 0.090%), Immigrants from Congo (41.8%, a difference of 0.12%), Indonesian (41.9%, a difference of 0.15%), Spanish American (41.8%, a difference of 0.18%), and French American Indian (42.0%, a difference of 0.25%).
DemographicsRating | RankAssociate's Degree
Immigrants | Ecuador
0.8
/100
|
#248
Tragic
42.2%
Jamaicans
0.7
/100
|
#249
Tragic
42.1%
U.S. Virgin Islanders
0.7
/100
|
#250
Tragic
42.1%
Immigrants | Bahamas
0.7
/100
|
#251
Tragic
42.1%
French American Indians
0.6
/100
|
#252
Tragic
42.0%
Indonesians
0.6
/100
|
#253
Tragic
41.9%
Cubans
0.6
/100
|
#254
Tragic
41.9%
Immigrants | Guyana
0.5
/100
|
#255
Tragic
41.8%
Immigrants | Congo
0.5
/100
|
#256
Tragic
41.8%
Spanish Americans
0.5
/100
|
#257
Tragic
41.8%
Japanese
0.5
/100
|
#258
Tragic
41.7%
Malaysians
0.4
/100
|
#259
Tragic
41.6%
Marshallese
0.4
/100
|
#260
Tragic
41.6%
Nicaraguans
0.4
/100
|
#261
Tragic
41.5%
Bahamians
0.4
/100
|
#262
Tragic
41.5%