Soviet Union vs Immigrants from Senegal Associate's Degree
COMPARE
Soviet Union
Immigrants from Senegal
Associate's Degree
Associate's Degree Comparison
Soviet Union
Immigrants from Senegal
55.1%
ASSOCIATE'S DEGREE
100.0/ 100
METRIC RATING
16th/ 347
METRIC RANK
45.2%
ASSOCIATE'S DEGREE
21.2/ 100
METRIC RATING
199th/ 347
METRIC RANK
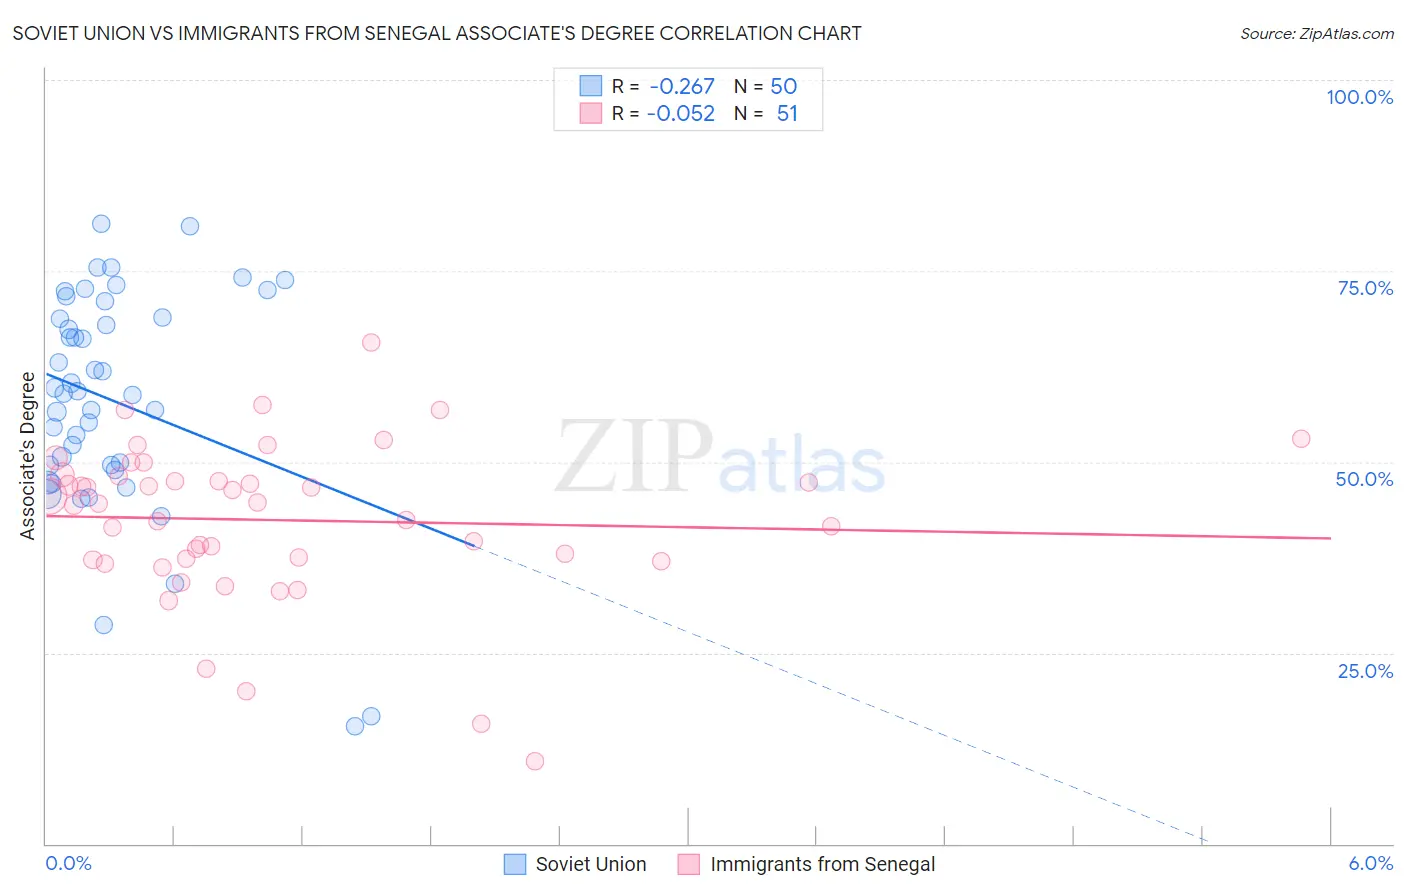
Soviet Union vs Immigrants from Senegal Associate's Degree Correlation Chart
The statistical analysis conducted on geographies consisting of 43,514,626 people shows a weak negative correlation between the proportion of Soviet Union and percentage of population with at least associate's degree education in the United States with a correlation coefficient (R) of -0.267 and weighted average of 55.1%. Similarly, the statistical analysis conducted on geographies consisting of 90,125,204 people shows a slight negative correlation between the proportion of Immigrants from Senegal and percentage of population with at least associate's degree education in the United States with a correlation coefficient (R) of -0.052 and weighted average of 45.2%, a difference of 21.9%.
Associate's Degree Correlation Summary
| Measurement | Soviet Union | Immigrants from Senegal |
| Minimum | 15.5% | 10.9% |
| Maximum | 81.2% | 65.7% |
| Range | 65.7% | 54.8% |
| Mean | 58.0% | 42.4% |
| Median | 59.1% | 44.5% |
| Interquartile 25% (IQ1) | 49.5% | 37.2% |
| Interquartile 75% (IQ3) | 68.9% | 48.1% |
| Interquartile Range (IQR) | 19.4% | 10.9% |
| Standard Deviation (Sample) | 14.7% | 10.3% |
| Standard Deviation (Population) | 14.5% | 10.2% |
Similar Demographics by Associate's Degree
Demographics Similar to Soviet Union by Associate's Degree
In terms of associate's degree, the demographic groups most similar to Soviet Union are Eastern European (55.0%, a difference of 0.14%), Immigrants from Eastern Asia (55.4%, a difference of 0.47%), Immigrants from Hong Kong (55.4%, a difference of 0.50%), Indian (Asian) (54.8%, a difference of 0.61%), and Immigrants from China (55.5%, a difference of 0.65%).
| Demographics | Rating | Rank | Associate's Degree |
| Immigrants | Israel | 100.0 /100 | #9 | Exceptional 56.8% |
| Cypriots | 100.0 /100 | #10 | Exceptional 56.4% |
| Immigrants | Australia | 100.0 /100 | #11 | Exceptional 55.8% |
| Immigrants | South Central Asia | 100.0 /100 | #12 | Exceptional 55.7% |
| Immigrants | China | 100.0 /100 | #13 | Exceptional 55.5% |
| Immigrants | Hong Kong | 100.0 /100 | #14 | Exceptional 55.4% |
| Immigrants | Eastern Asia | 100.0 /100 | #15 | Exceptional 55.4% |
| Soviet Union | 100.0 /100 | #16 | Exceptional 55.1% |
| Eastern Europeans | 100.0 /100 | #17 | Exceptional 55.0% |
| Indians (Asian) | 100.0 /100 | #18 | Exceptional 54.8% |
| Immigrants | Ireland | 100.0 /100 | #19 | Exceptional 54.7% |
| Cambodians | 100.0 /100 | #20 | Exceptional 54.6% |
| Immigrants | Sweden | 100.0 /100 | #21 | Exceptional 54.6% |
| Immigrants | Japan | 100.0 /100 | #22 | Exceptional 54.6% |
| Burmese | 100.0 /100 | #23 | Exceptional 54.6% |
Demographics Similar to Immigrants from Senegal by Associate's Degree
In terms of associate's degree, the demographic groups most similar to Immigrants from Senegal are Senegalese (45.2%, a difference of 0.010%), Immigrants from Bangladesh (45.2%, a difference of 0.020%), Immigrants from Vietnam (45.2%, a difference of 0.040%), Spaniard (45.2%, a difference of 0.090%), and Immigrants from South Eastern Asia (45.2%, a difference of 0.11%).
| Demographics | Rating | Rank | Associate's Degree |
| Celtics | 33.3 /100 | #192 | Fair 45.8% |
| Immigrants | Cameroon | 31.0 /100 | #193 | Fair 45.7% |
| Immigrants | Peru | 27.6 /100 | #194 | Fair 45.5% |
| Germans | 26.5 /100 | #195 | Fair 45.5% |
| French | 25.6 /100 | #196 | Fair 45.4% |
| Scotch-Irish | 22.3 /100 | #197 | Fair 45.3% |
| Immigrants | Bangladesh | 21.3 /100 | #198 | Fair 45.2% |
| Immigrants | Senegal | 21.2 /100 | #199 | Fair 45.2% |
| Senegalese | 21.1 /100 | #200 | Fair 45.2% |
| Immigrants | Vietnam | 20.8 /100 | #201 | Fair 45.2% |
| Spaniards | 20.4 /100 | #202 | Fair 45.2% |
| Immigrants | South Eastern Asia | 20.2 /100 | #203 | Fair 45.2% |
| Nigerians | 19.1 /100 | #204 | Poor 45.1% |
| Immigrants | Thailand | 18.9 /100 | #205 | Poor 45.1% |
| German Russians | 18.9 /100 | #206 | Poor 45.1% |