Albanian vs Immigrants from the Azores Child Poverty Under the Age of 5
COMPARE
Albanian
Immigrants from the Azores
Child Poverty Under the Age of 5
Child Poverty Under the Age of 5 Comparison
Albanians
Immigrants from the Azores
16.0%
CHILD POVERTY UNDER THE AGE OF 5
93.8/ 100
METRIC RATING
115th/ 347
METRIC RANK
18.9%
CHILD POVERTY UNDER THE AGE OF 5
2.6/ 100
METRIC RATING
220th/ 347
METRIC RANK
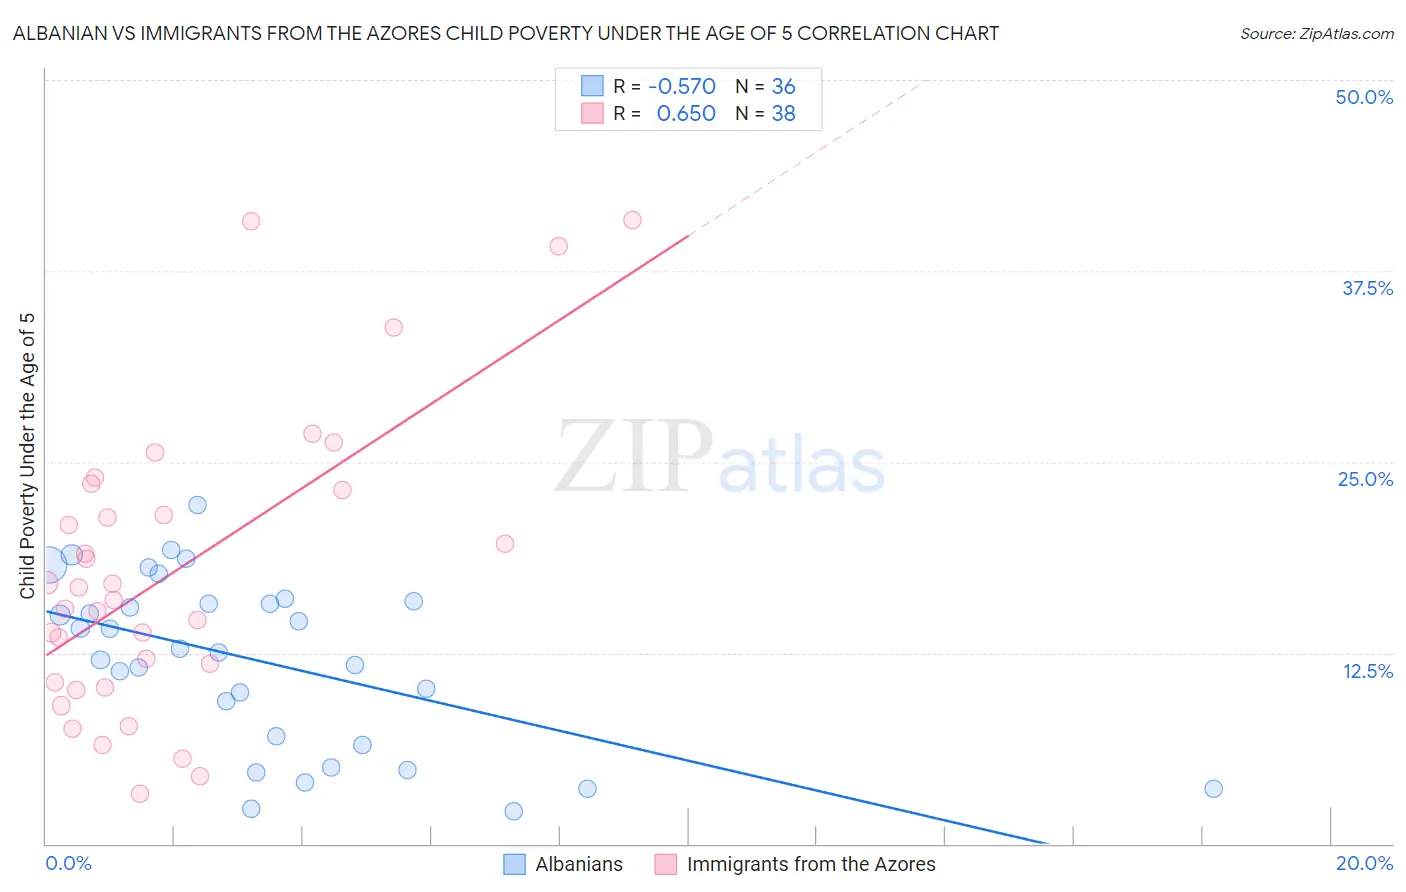
Albanian vs Immigrants from the Azores Child Poverty Under the Age of 5 Correlation Chart
The statistical analysis conducted on geographies consisting of 186,792,170 people shows a substantial negative correlation between the proportion of Albanians and poverty level among children under the age of 5 in the United States with a correlation coefficient (R) of -0.570 and weighted average of 16.0%. Similarly, the statistical analysis conducted on geographies consisting of 45,317,352 people shows a significant positive correlation between the proportion of Immigrants from the Azores and poverty level among children under the age of 5 in the United States with a correlation coefficient (R) of 0.650 and weighted average of 18.9%, a difference of 17.7%.
Child Poverty Under the Age of 5 Correlation Summary
| Measurement | Albanian | Immigrants from the Azores |
| Minimum | 2.1% | 3.3% |
| Maximum | 22.2% | 40.8% |
| Range | 20.1% | 37.5% |
| Mean | 11.9% | 17.8% |
| Median | 12.6% | 16.4% |
| Interquartile 25% (IQ1) | 6.8% | 10.6% |
| Interquartile 75% (IQ3) | 15.8% | 23.2% |
| Interquartile Range (IQR) | 9.0% | 12.6% |
| Standard Deviation (Sample) | 5.6% | 9.6% |
| Standard Deviation (Population) | 5.5% | 9.4% |
Similar Demographics by Child Poverty Under the Age of 5
Demographics Similar to Albanians by Child Poverty Under the Age of 5
In terms of child poverty under the age of 5, the demographic groups most similar to Albanians are Immigrants from Kuwait (16.0%, a difference of 0.020%), Puget Sound Salish (16.0%, a difference of 0.11%), Peruvian (16.0%, a difference of 0.12%), Pakistani (16.0%, a difference of 0.17%), and Immigrants from Austria (16.0%, a difference of 0.17%).
| Demographics | Rating | Rank | Child Poverty Under the Age of 5 |
| Immigrants | Brazil | 94.4 /100 | #108 | Exceptional 16.0% |
| Northern Europeans | 94.3 /100 | #109 | Exceptional 16.0% |
| Romanians | 94.3 /100 | #110 | Exceptional 16.0% |
| Pakistanis | 94.2 /100 | #111 | Exceptional 16.0% |
| Peruvians | 94.1 /100 | #112 | Exceptional 16.0% |
| Puget Sound Salish | 94.1 /100 | #113 | Exceptional 16.0% |
| Immigrants | Kuwait | 93.9 /100 | #114 | Exceptional 16.0% |
| Albanians | 93.8 /100 | #115 | Exceptional 16.0% |
| Immigrants | Austria | 93.5 /100 | #116 | Exceptional 16.0% |
| Basques | 93.4 /100 | #117 | Exceptional 16.0% |
| Immigrants | Denmark | 93.4 /100 | #118 | Exceptional 16.0% |
| Immigrants | Jordan | 93.2 /100 | #119 | Exceptional 16.1% |
| Immigrants | Peru | 92.6 /100 | #120 | Exceptional 16.1% |
| Mongolians | 92.5 /100 | #121 | Exceptional 16.1% |
| Immigrants | Southern Europe | 92.0 /100 | #122 | Exceptional 16.1% |
Demographics Similar to Immigrants from the Azores by Child Poverty Under the Age of 5
In terms of child poverty under the age of 5, the demographic groups most similar to Immigrants from the Azores are German Russian (18.8%, a difference of 0.36%), Immigrants from Nigeria (19.0%, a difference of 0.56%), Delaware (18.7%, a difference of 0.67%), Alsatian (19.1%, a difference of 1.1%), and Cuban (19.1%, a difference of 1.1%).
| Demographics | Rating | Rank | Child Poverty Under the Age of 5 |
| Immigrants | Thailand | 8.6 /100 | #213 | Tragic 18.3% |
| Malaysians | 6.5 /100 | #214 | Tragic 18.4% |
| Immigrants | Panama | 6.0 /100 | #215 | Tragic 18.5% |
| Hmong | 5.0 /100 | #216 | Tragic 18.5% |
| Immigrants | Africa | 4.6 /100 | #217 | Tragic 18.6% |
| Delaware | 3.4 /100 | #218 | Tragic 18.7% |
| German Russians | 3.0 /100 | #219 | Tragic 18.8% |
| Immigrants | Azores | 2.6 /100 | #220 | Tragic 18.9% |
| Immigrants | Nigeria | 2.1 /100 | #221 | Tragic 19.0% |
| Alsatians | 1.7 /100 | #222 | Tragic 19.1% |
| Cubans | 1.7 /100 | #223 | Tragic 19.1% |
| Nicaraguans | 1.6 /100 | #224 | Tragic 19.1% |
| Nigerians | 1.6 /100 | #225 | Tragic 19.1% |
| Immigrants | Eritrea | 1.5 /100 | #226 | Tragic 19.1% |
| Cape Verdeans | 1.4 /100 | #227 | Tragic 19.1% |