Aleut vs Immigrants from the Azores GED/Equivalency
COMPARE
Aleut
Immigrants from the Azores
GED/Equivalency
GED/Equivalency Comparison
Aleuts
Immigrants from the Azores
85.6%
GED/EQUIVALENCY
40.5/ 100
METRIC RATING
179th/ 347
METRIC RANK
78.7%
GED/EQUIVALENCY
0.0/ 100
METRIC RATING
332nd/ 347
METRIC RANK
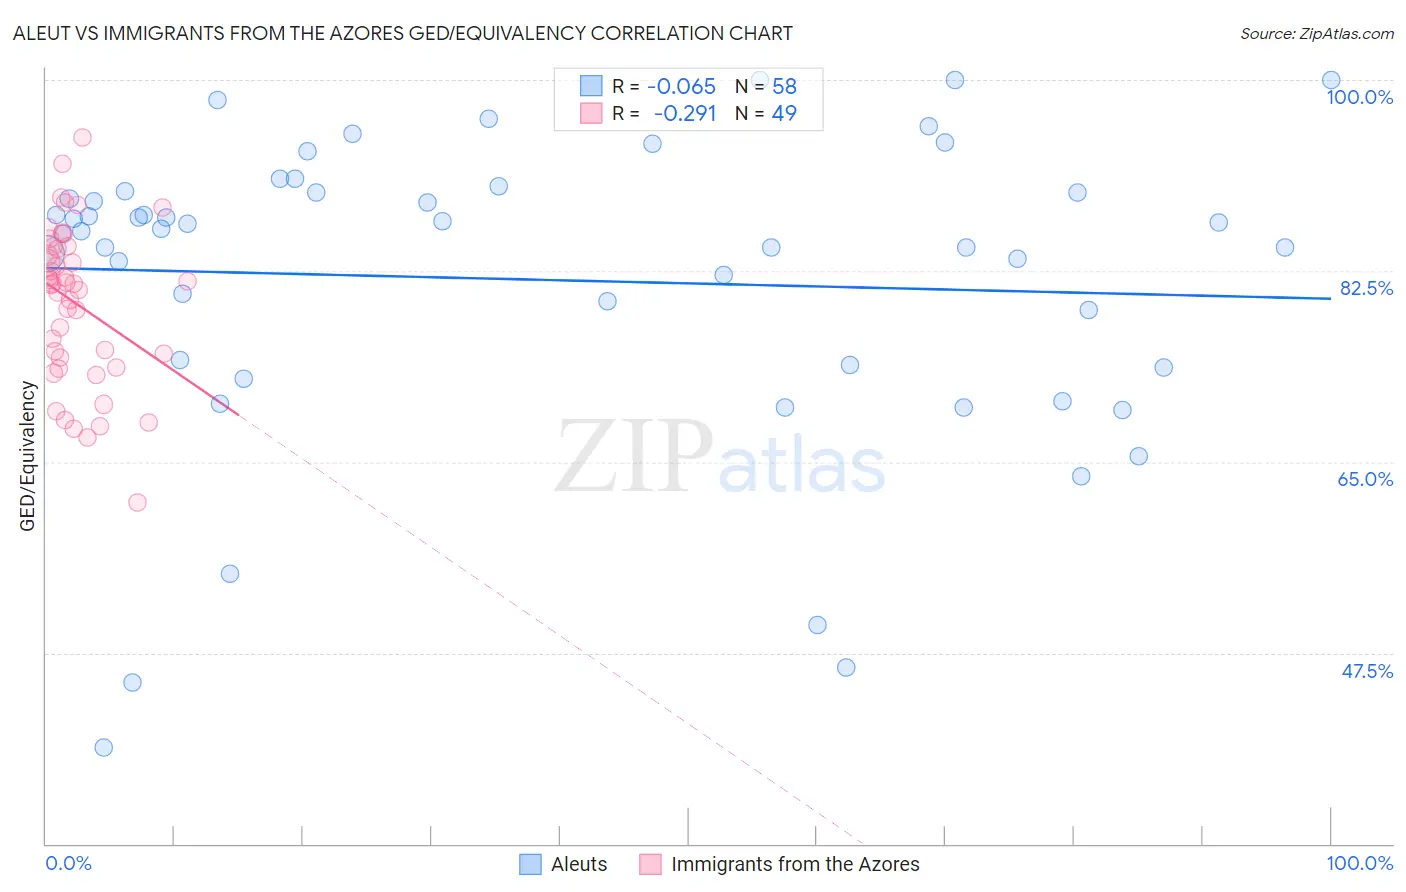
Aleut vs Immigrants from the Azores GED/Equivalency Correlation Chart
The statistical analysis conducted on geographies consisting of 61,782,940 people shows a slight negative correlation between the proportion of Aleuts and percentage of population with at least ged/equivalency education in the United States with a correlation coefficient (R) of -0.065 and weighted average of 85.6%. Similarly, the statistical analysis conducted on geographies consisting of 46,257,310 people shows a weak negative correlation between the proportion of Immigrants from the Azores and percentage of population with at least ged/equivalency education in the United States with a correlation coefficient (R) of -0.291 and weighted average of 78.7%, a difference of 8.8%.
GED/Equivalency Correlation Summary
| Measurement | Aleut | Immigrants from the Azores |
| Minimum | 38.8% | 61.3% |
| Maximum | 100.0% | 94.8% |
| Range | 61.2% | 33.5% |
| Mean | 81.7% | 79.5% |
| Median | 86.3% | 81.3% |
| Interquartile 25% (IQ1) | 73.9% | 74.2% |
| Interquartile 75% (IQ3) | 89.7% | 84.6% |
| Interquartile Range (IQR) | 15.8% | 10.5% |
| Standard Deviation (Sample) | 13.9% | 7.2% |
| Standard Deviation (Population) | 13.8% | 7.1% |
Similar Demographics by GED/Equivalency
Demographics Similar to Aleuts by GED/Equivalency
In terms of ged/equivalency, the demographic groups most similar to Aleuts are Korean (85.6%, a difference of 0.020%), Immigrants from Southern Europe (85.5%, a difference of 0.040%), Moroccan (85.5%, a difference of 0.060%), Immigrants from Uganda (85.7%, a difference of 0.10%), and Sudanese (85.5%, a difference of 0.12%).
| Demographics | Rating | Rank | GED/Equivalency |
| Bermudans | 55.1 /100 | #172 | Average 85.8% |
| Immigrants | Venezuela | 50.7 /100 | #173 | Average 85.8% |
| Ottawa | 50.0 /100 | #174 | Average 85.8% |
| Immigrants | Bolivia | 49.8 /100 | #175 | Average 85.8% |
| Immigrants | Eastern Africa | 47.7 /100 | #176 | Average 85.7% |
| Immigrants | Uganda | 45.2 /100 | #177 | Average 85.7% |
| Koreans | 41.2 /100 | #178 | Average 85.6% |
| Aleuts | 40.5 /100 | #179 | Average 85.6% |
| Immigrants | Southern Europe | 38.4 /100 | #180 | Fair 85.5% |
| Moroccans | 37.7 /100 | #181 | Fair 85.5% |
| Sudanese | 35.2 /100 | #182 | Fair 85.5% |
| Immigrants | Sudan | 34.2 /100 | #183 | Fair 85.5% |
| Immigrants | Oceania | 33.6 /100 | #184 | Fair 85.5% |
| Spanish | 32.8 /100 | #185 | Fair 85.4% |
| Spaniards | 31.9 /100 | #186 | Fair 85.4% |
Demographics Similar to Immigrants from the Azores by GED/Equivalency
In terms of ged/equivalency, the demographic groups most similar to Immigrants from the Azores are Immigrants from Honduras (78.7%, a difference of 0.11%), Salvadoran (78.6%, a difference of 0.11%), Guatemalan (78.5%, a difference of 0.20%), Immigrants from Latin America (78.5%, a difference of 0.22%), and Immigrants from Cabo Verde (78.9%, a difference of 0.36%).
| Demographics | Rating | Rank | GED/Equivalency |
| Hondurans | 0.0 /100 | #325 | Tragic 79.3% |
| Yuman | 0.0 /100 | #326 | Tragic 79.2% |
| Central Americans | 0.0 /100 | #327 | Tragic 79.2% |
| Hispanics or Latinos | 0.0 /100 | #328 | Tragic 79.1% |
| Dominicans | 0.0 /100 | #329 | Tragic 79.1% |
| Immigrants | Cabo Verde | 0.0 /100 | #330 | Tragic 78.9% |
| Immigrants | Honduras | 0.0 /100 | #331 | Tragic 78.7% |
| Immigrants | Azores | 0.0 /100 | #332 | Tragic 78.7% |
| Salvadorans | 0.0 /100 | #333 | Tragic 78.6% |
| Guatemalans | 0.0 /100 | #334 | Tragic 78.5% |
| Immigrants | Latin America | 0.0 /100 | #335 | Tragic 78.5% |
| Immigrants | Dominican Republic | 0.0 /100 | #336 | Tragic 78.0% |
| Immigrants | Yemen | 0.0 /100 | #337 | Tragic 77.9% |
| Immigrants | Guatemala | 0.0 /100 | #338 | Tragic 77.9% |
| Immigrants | El Salvador | 0.0 /100 | #339 | Tragic 77.6% |