Puerto Rican vs Immigrants from the Azores GED/Equivalency
COMPARE
Puerto Rican
Immigrants from the Azores
GED/Equivalency
GED/Equivalency Comparison
Puerto Ricans
Immigrants from the Azores
81.1%
GED/EQUIVALENCY
0.0/ 100
METRIC RATING
308th/ 347
METRIC RANK
78.7%
GED/EQUIVALENCY
0.0/ 100
METRIC RATING
332nd/ 347
METRIC RANK
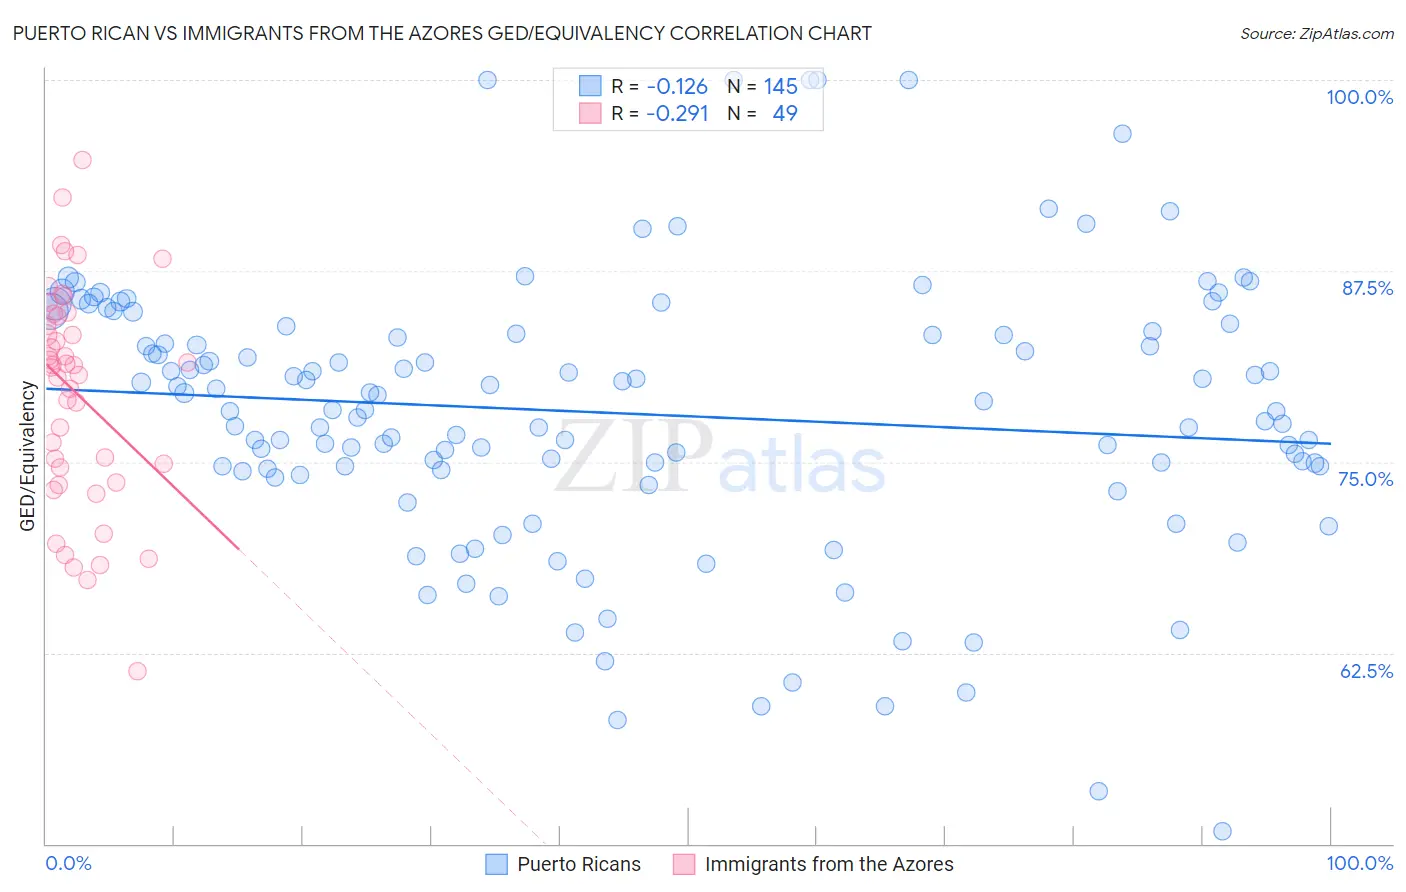
Puerto Rican vs Immigrants from the Azores GED/Equivalency Correlation Chart
The statistical analysis conducted on geographies consisting of 528,320,760 people shows a poor negative correlation between the proportion of Puerto Ricans and percentage of population with at least ged/equivalency education in the United States with a correlation coefficient (R) of -0.126 and weighted average of 81.1%. Similarly, the statistical analysis conducted on geographies consisting of 46,257,310 people shows a weak negative correlation between the proportion of Immigrants from the Azores and percentage of population with at least ged/equivalency education in the United States with a correlation coefficient (R) of -0.291 and weighted average of 78.7%, a difference of 3.1%.
GED/Equivalency Correlation Summary
| Measurement | Puerto Rican | Immigrants from the Azores |
| Minimum | 50.8% | 61.3% |
| Maximum | 100.0% | 94.8% |
| Range | 49.2% | 33.5% |
| Mean | 78.2% | 79.5% |
| Median | 78.4% | 81.3% |
| Interquartile 25% (IQ1) | 74.5% | 74.2% |
| Interquartile 75% (IQ3) | 83.5% | 84.6% |
| Interquartile Range (IQR) | 9.0% | 10.5% |
| Standard Deviation (Sample) | 9.0% | 7.2% |
| Standard Deviation (Population) | 8.9% | 7.1% |
Similar Demographics by GED/Equivalency
Demographics Similar to Puerto Ricans by GED/Equivalency
In terms of ged/equivalency, the demographic groups most similar to Puerto Ricans are Immigrants from Ecuador (81.0%, a difference of 0.080%), Immigrants from Dominica (81.1%, a difference of 0.10%), Immigrants from Guyana (81.0%, a difference of 0.14%), Native/Alaskan (80.9%, a difference of 0.14%), and Nicaraguan (80.9%, a difference of 0.18%).
| Demographics | Rating | Rank | GED/Equivalency |
| Dutch West Indians | 0.0 /100 | #301 | Tragic 81.6% |
| Immigrants | Haiti | 0.0 /100 | #302 | Tragic 81.6% |
| Immigrants | Portugal | 0.0 /100 | #303 | Tragic 81.6% |
| Navajo | 0.0 /100 | #304 | Tragic 81.5% |
| Immigrants | Grenada | 0.0 /100 | #305 | Tragic 81.3% |
| Guyanese | 0.0 /100 | #306 | Tragic 81.3% |
| Immigrants | Dominica | 0.0 /100 | #307 | Tragic 81.1% |
| Puerto Ricans | 0.0 /100 | #308 | Tragic 81.1% |
| Immigrants | Ecuador | 0.0 /100 | #309 | Tragic 81.0% |
| Immigrants | Guyana | 0.0 /100 | #310 | Tragic 81.0% |
| Natives/Alaskans | 0.0 /100 | #311 | Tragic 80.9% |
| Nicaraguans | 0.0 /100 | #312 | Tragic 80.9% |
| Cape Verdeans | 0.0 /100 | #313 | Tragic 80.9% |
| Belizeans | 0.0 /100 | #314 | Tragic 80.9% |
| Apache | 0.0 /100 | #315 | Tragic 80.7% |
Demographics Similar to Immigrants from the Azores by GED/Equivalency
In terms of ged/equivalency, the demographic groups most similar to Immigrants from the Azores are Immigrants from Honduras (78.7%, a difference of 0.11%), Salvadoran (78.6%, a difference of 0.11%), Guatemalan (78.5%, a difference of 0.20%), Immigrants from Latin America (78.5%, a difference of 0.22%), and Immigrants from Cabo Verde (78.9%, a difference of 0.36%).
| Demographics | Rating | Rank | GED/Equivalency |
| Hondurans | 0.0 /100 | #325 | Tragic 79.3% |
| Yuman | 0.0 /100 | #326 | Tragic 79.2% |
| Central Americans | 0.0 /100 | #327 | Tragic 79.2% |
| Hispanics or Latinos | 0.0 /100 | #328 | Tragic 79.1% |
| Dominicans | 0.0 /100 | #329 | Tragic 79.1% |
| Immigrants | Cabo Verde | 0.0 /100 | #330 | Tragic 78.9% |
| Immigrants | Honduras | 0.0 /100 | #331 | Tragic 78.7% |
| Immigrants | Azores | 0.0 /100 | #332 | Tragic 78.7% |
| Salvadorans | 0.0 /100 | #333 | Tragic 78.6% |
| Guatemalans | 0.0 /100 | #334 | Tragic 78.5% |
| Immigrants | Latin America | 0.0 /100 | #335 | Tragic 78.5% |
| Immigrants | Dominican Republic | 0.0 /100 | #336 | Tragic 78.0% |
| Immigrants | Yemen | 0.0 /100 | #337 | Tragic 77.9% |
| Immigrants | Guatemala | 0.0 /100 | #338 | Tragic 77.9% |
| Immigrants | El Salvador | 0.0 /100 | #339 | Tragic 77.6% |