Asian vs Marshallese GED/Equivalency
COMPARE
Asian
Marshallese
GED/Equivalency
GED/Equivalency Comparison
Asians
Marshallese
86.7%
GED/EQUIVALENCY
90.3/ 100
METRIC RATING
126th/ 347
METRIC RANK
84.9%
GED/EQUIVALENCY
12.5/ 100
METRIC RATING
208th/ 347
METRIC RANK
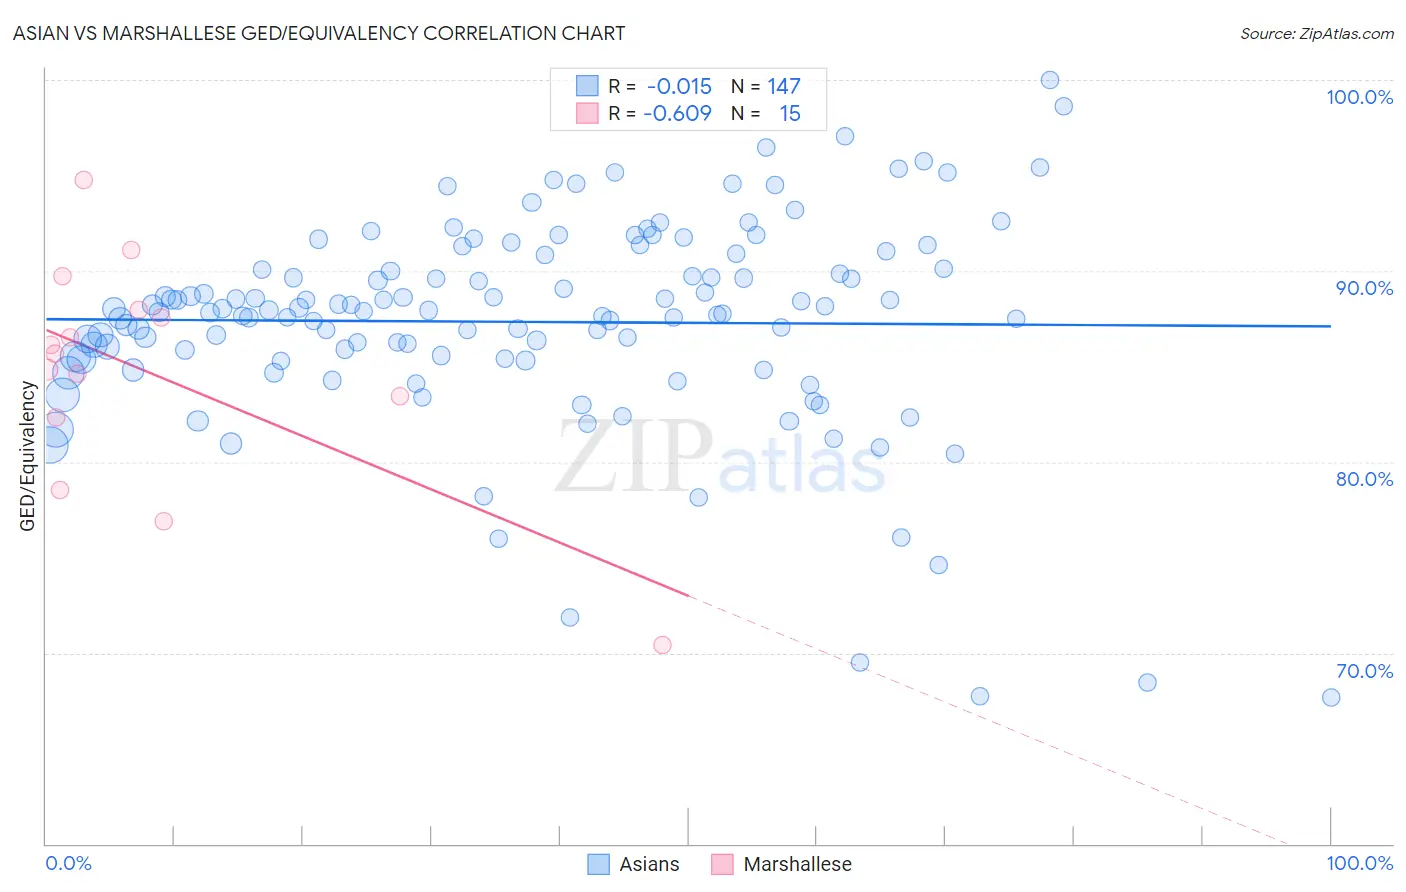
Asian vs Marshallese GED/Equivalency Correlation Chart
The statistical analysis conducted on geographies consisting of 550,857,886 people shows no correlation between the proportion of Asians and percentage of population with at least ged/equivalency education in the United States with a correlation coefficient (R) of -0.015 and weighted average of 86.7%. Similarly, the statistical analysis conducted on geographies consisting of 14,760,991 people shows a significant negative correlation between the proportion of Marshallese and percentage of population with at least ged/equivalency education in the United States with a correlation coefficient (R) of -0.609 and weighted average of 84.9%, a difference of 2.2%.
GED/Equivalency Correlation Summary
| Measurement | Asian | Marshallese |
| Minimum | 67.7% | 70.4% |
| Maximum | 100.0% | 94.8% |
| Range | 32.3% | 24.4% |
| Mean | 87.3% | 84.7% |
| Median | 87.9% | 85.7% |
| Interquartile 25% (IQ1) | 85.4% | 82.3% |
| Interquartile 75% (IQ3) | 90.1% | 88.0% |
| Interquartile Range (IQR) | 4.8% | 5.6% |
| Standard Deviation (Sample) | 5.5% | 6.0% |
| Standard Deviation (Population) | 5.5% | 5.8% |
Similar Demographics by GED/Equivalency
Demographics Similar to Asians by GED/Equivalency
In terms of ged/equivalency, the demographic groups most similar to Asians are Immigrants from Egypt (86.7%, a difference of 0.010%), Celtic (86.7%, a difference of 0.010%), Immigrants from Italy (86.7%, a difference of 0.020%), Immigrants from Jordan (86.8%, a difference of 0.030%), and Argentinean (86.7%, a difference of 0.030%).
| Demographics | Rating | Rank | GED/Equivalency |
| Immigrants | China | 93.2 /100 | #119 | Exceptional 86.9% |
| Scotch-Irish | 91.6 /100 | #120 | Exceptional 86.8% |
| Immigrants | Lebanon | 90.9 /100 | #121 | Exceptional 86.8% |
| Immigrants | Jordan | 90.8 /100 | #122 | Exceptional 86.8% |
| Immigrants | Italy | 90.5 /100 | #123 | Exceptional 86.7% |
| Immigrants | Egypt | 90.4 /100 | #124 | Exceptional 86.7% |
| Celtics | 90.4 /100 | #125 | Exceptional 86.7% |
| Asians | 90.3 /100 | #126 | Exceptional 86.7% |
| Argentineans | 89.7 /100 | #127 | Excellent 86.7% |
| Yugoslavians | 89.5 /100 | #128 | Excellent 86.7% |
| Immigrants | Ukraine | 88.9 /100 | #129 | Excellent 86.7% |
| Immigrants | Germany | 88.8 /100 | #130 | Excellent 86.7% |
| Immigrants | Spain | 88.5 /100 | #131 | Excellent 86.7% |
| Immigrants | Brazil | 88.4 /100 | #132 | Excellent 86.6% |
| Tsimshian | 88.3 /100 | #133 | Excellent 86.6% |
Demographics Similar to Marshallese by GED/Equivalency
In terms of ged/equivalency, the demographic groups most similar to Marshallese are Colombian (84.9%, a difference of 0.010%), Immigrants from Cameroon (84.9%, a difference of 0.020%), Hmong (84.9%, a difference of 0.030%), Samoan (84.9%, a difference of 0.050%), and South American (84.8%, a difference of 0.080%).
| Demographics | Rating | Rank | GED/Equivalency |
| Portuguese | 15.9 /100 | #201 | Poor 85.0% |
| Cree | 15.9 /100 | #202 | Poor 85.0% |
| Panamanians | 15.3 /100 | #203 | Poor 85.0% |
| Hawaiians | 15.2 /100 | #204 | Poor 85.0% |
| Liberians | 14.6 /100 | #205 | Poor 85.0% |
| Samoans | 13.7 /100 | #206 | Poor 84.9% |
| Hmong | 13.1 /100 | #207 | Poor 84.9% |
| Marshallese | 12.5 /100 | #208 | Poor 84.9% |
| Colombians | 12.3 /100 | #209 | Poor 84.9% |
| Immigrants | Cameroon | 12.1 /100 | #210 | Poor 84.9% |
| South Americans | 10.9 /100 | #211 | Poor 84.8% |
| Immigrants | Somalia | 10.6 /100 | #212 | Poor 84.8% |
| Immigrants | Philippines | 10.0 /100 | #213 | Poor 84.8% |
| Osage | 9.5 /100 | #214 | Tragic 84.8% |
| Peruvians | 9.2 /100 | #215 | Tragic 84.7% |