Yakama vs Marshallese GED/Equivalency
COMPARE
Yakama
Marshallese
GED/Equivalency
GED/Equivalency Comparison
Yakama
Marshallese
74.5%
GED/EQUIVALENCY
0.0/ 100
METRIC RATING
347th/ 347
METRIC RANK
84.9%
GED/EQUIVALENCY
12.5/ 100
METRIC RATING
208th/ 347
METRIC RANK
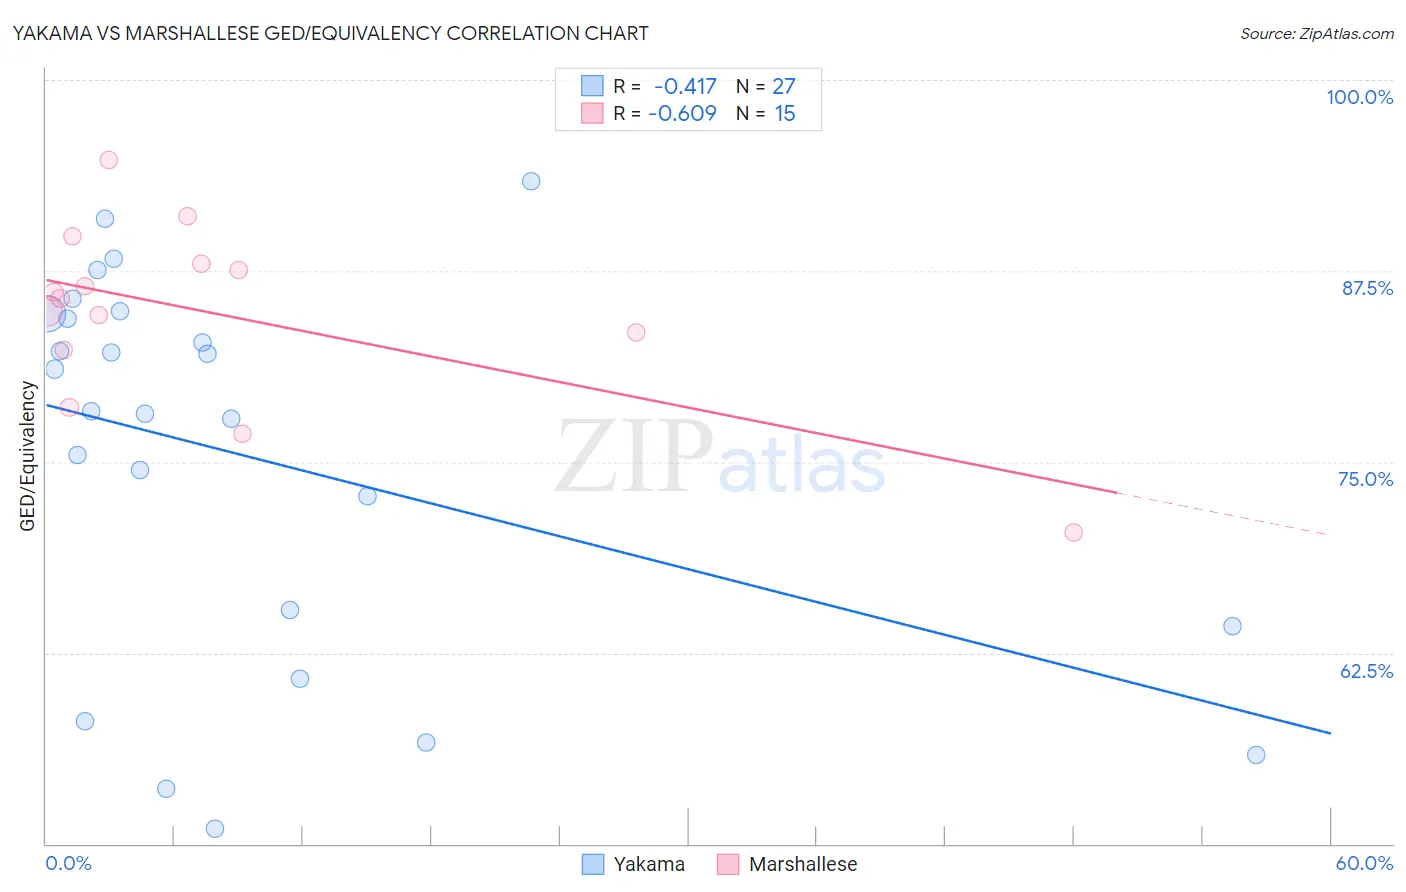
Yakama vs Marshallese GED/Equivalency Correlation Chart
The statistical analysis conducted on geographies consisting of 19,923,144 people shows a moderate negative correlation between the proportion of Yakama and percentage of population with at least ged/equivalency education in the United States with a correlation coefficient (R) of -0.417 and weighted average of 74.5%. Similarly, the statistical analysis conducted on geographies consisting of 14,760,991 people shows a significant negative correlation between the proportion of Marshallese and percentage of population with at least ged/equivalency education in the United States with a correlation coefficient (R) of -0.609 and weighted average of 84.9%, a difference of 13.9%.
GED/Equivalency Correlation Summary
| Measurement | Yakama | Marshallese |
| Minimum | 51.0% | 70.4% |
| Maximum | 93.3% | 94.8% |
| Range | 42.4% | 24.4% |
| Mean | 75.3% | 84.7% |
| Median | 78.4% | 85.7% |
| Interquartile 25% (IQ1) | 64.2% | 82.3% |
| Interquartile 75% (IQ3) | 84.7% | 88.0% |
| Interquartile Range (IQR) | 20.4% | 5.6% |
| Standard Deviation (Sample) | 12.5% | 6.0% |
| Standard Deviation (Population) | 12.2% | 5.8% |
Similar Demographics by GED/Equivalency
Demographics Similar to Yakama by GED/Equivalency
In terms of ged/equivalency, the demographic groups most similar to Yakama are Houma (75.0%, a difference of 0.61%), Immigrants from Mexico (75.7%, a difference of 1.6%), Spanish American Indian (76.3%, a difference of 2.5%), Immigrants from Central America (76.4%, a difference of 2.5%), and Pima (76.4%, a difference of 2.6%).
| Demographics | Rating | Rank | GED/Equivalency |
| Salvadorans | 0.0 /100 | #333 | Tragic 78.6% |
| Guatemalans | 0.0 /100 | #334 | Tragic 78.5% |
| Immigrants | Latin America | 0.0 /100 | #335 | Tragic 78.5% |
| Immigrants | Dominican Republic | 0.0 /100 | #336 | Tragic 78.0% |
| Immigrants | Yemen | 0.0 /100 | #337 | Tragic 77.9% |
| Immigrants | Guatemala | 0.0 /100 | #338 | Tragic 77.9% |
| Immigrants | El Salvador | 0.0 /100 | #339 | Tragic 77.6% |
| Tohono O'odham | 0.0 /100 | #340 | Tragic 77.5% |
| Mexicans | 0.0 /100 | #341 | Tragic 77.4% |
| Pima | 0.0 /100 | #342 | Tragic 76.4% |
| Immigrants | Central America | 0.0 /100 | #343 | Tragic 76.4% |
| Spanish American Indians | 0.0 /100 | #344 | Tragic 76.3% |
| Immigrants | Mexico | 0.0 /100 | #345 | Tragic 75.7% |
| Houma | 0.0 /100 | #346 | Tragic 75.0% |
| Yakama | 0.0 /100 | #347 | Tragic 74.5% |
Demographics Similar to Marshallese by GED/Equivalency
In terms of ged/equivalency, the demographic groups most similar to Marshallese are Colombian (84.9%, a difference of 0.010%), Immigrants from Cameroon (84.9%, a difference of 0.020%), Hmong (84.9%, a difference of 0.030%), Samoan (84.9%, a difference of 0.050%), and South American (84.8%, a difference of 0.080%).
| Demographics | Rating | Rank | GED/Equivalency |
| Portuguese | 15.9 /100 | #201 | Poor 85.0% |
| Cree | 15.9 /100 | #202 | Poor 85.0% |
| Panamanians | 15.3 /100 | #203 | Poor 85.0% |
| Hawaiians | 15.2 /100 | #204 | Poor 85.0% |
| Liberians | 14.6 /100 | #205 | Poor 85.0% |
| Samoans | 13.7 /100 | #206 | Poor 84.9% |
| Hmong | 13.1 /100 | #207 | Poor 84.9% |
| Marshallese | 12.5 /100 | #208 | Poor 84.9% |
| Colombians | 12.3 /100 | #209 | Poor 84.9% |
| Immigrants | Cameroon | 12.1 /100 | #210 | Poor 84.9% |
| South Americans | 10.9 /100 | #211 | Poor 84.8% |
| Immigrants | Somalia | 10.6 /100 | #212 | Poor 84.8% |
| Immigrants | Philippines | 10.0 /100 | #213 | Poor 84.8% |
| Osage | 9.5 /100 | #214 | Tragic 84.8% |
| Peruvians | 9.2 /100 | #215 | Tragic 84.7% |