Cambodian vs Marshallese GED/Equivalency
COMPARE
Cambodian
Marshallese
GED/Equivalency
GED/Equivalency Comparison
Cambodians
Marshallese
88.2%
GED/EQUIVALENCY
99.6/ 100
METRIC RATING
42nd/ 347
METRIC RANK
84.9%
GED/EQUIVALENCY
12.5/ 100
METRIC RATING
208th/ 347
METRIC RANK
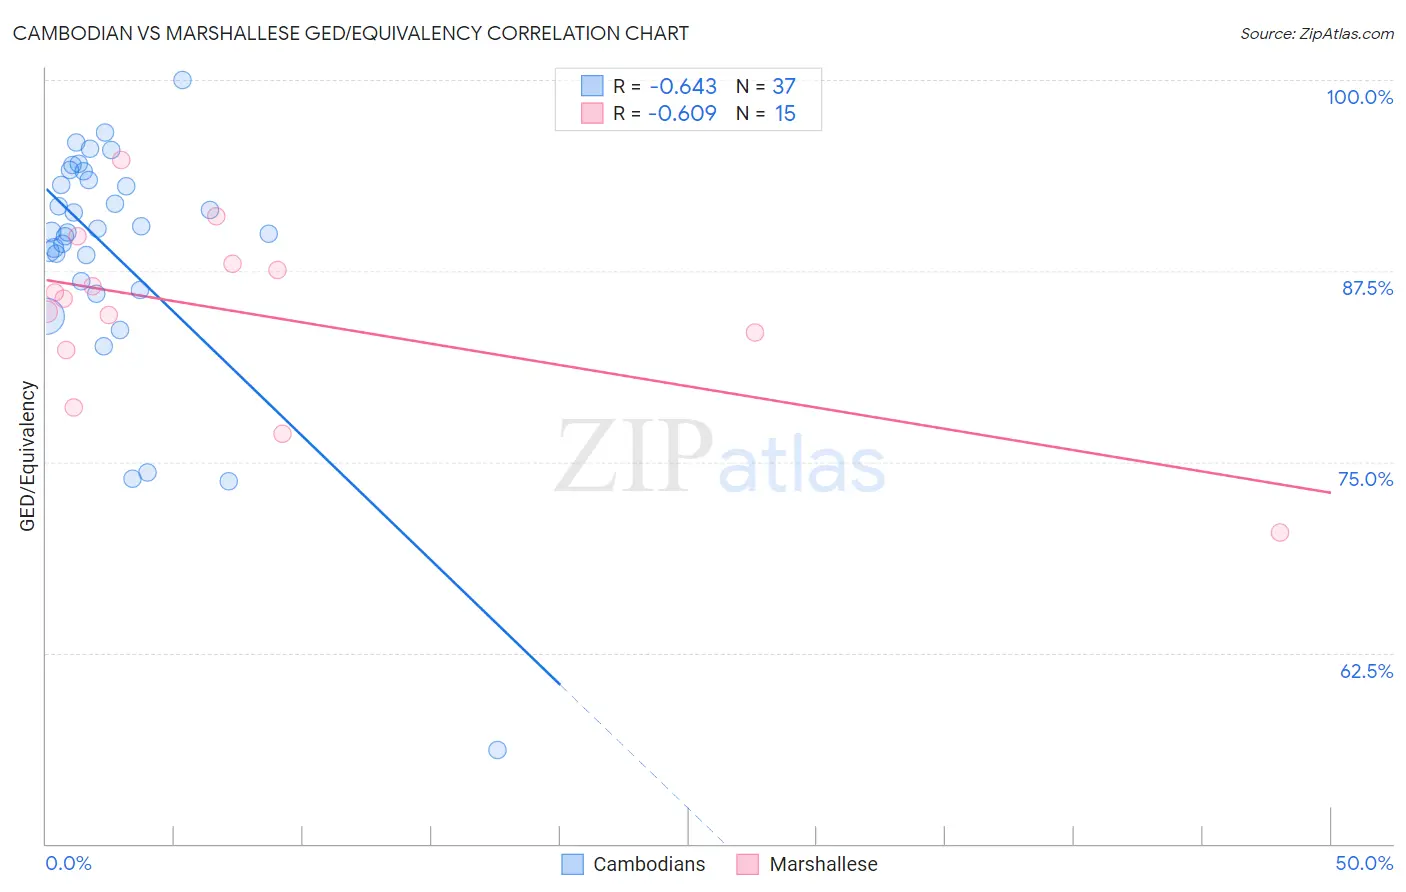
Cambodian vs Marshallese GED/Equivalency Correlation Chart
The statistical analysis conducted on geographies consisting of 102,514,874 people shows a significant negative correlation between the proportion of Cambodians and percentage of population with at least ged/equivalency education in the United States with a correlation coefficient (R) of -0.643 and weighted average of 88.2%. Similarly, the statistical analysis conducted on geographies consisting of 14,760,991 people shows a significant negative correlation between the proportion of Marshallese and percentage of population with at least ged/equivalency education in the United States with a correlation coefficient (R) of -0.609 and weighted average of 84.9%, a difference of 3.8%.
GED/Equivalency Correlation Summary
| Measurement | Cambodian | Marshallese |
| Minimum | 56.1% | 70.4% |
| Maximum | 100.0% | 94.8% |
| Range | 43.9% | 24.4% |
| Mean | 88.6% | 84.7% |
| Median | 90.1% | 85.7% |
| Interquartile 25% (IQ1) | 86.5% | 82.3% |
| Interquartile 75% (IQ3) | 93.8% | 88.0% |
| Interquartile Range (IQR) | 7.2% | 5.6% |
| Standard Deviation (Sample) | 8.1% | 6.0% |
| Standard Deviation (Population) | 8.0% | 5.8% |
Similar Demographics by GED/Equivalency
Demographics Similar to Cambodians by GED/Equivalency
In terms of ged/equivalency, the demographic groups most similar to Cambodians are Immigrants from Scotland (88.2%, a difference of 0.0%), Finnish (88.2%, a difference of 0.030%), Italian (88.2%, a difference of 0.040%), Macedonian (88.1%, a difference of 0.040%), and Immigrants from Israel (88.2%, a difference of 0.060%).
| Demographics | Rating | Rank | GED/Equivalency |
| Immigrants | South Central Asia | 99.7 /100 | #35 | Exceptional 88.4% |
| Immigrants | Belgium | 99.7 /100 | #36 | Exceptional 88.3% |
| Immigrants | Austria | 99.7 /100 | #37 | Exceptional 88.3% |
| Burmese | 99.7 /100 | #38 | Exceptional 88.3% |
| Immigrants | Israel | 99.6 /100 | #39 | Exceptional 88.2% |
| Italians | 99.6 /100 | #40 | Exceptional 88.2% |
| Finns | 99.6 /100 | #41 | Exceptional 88.2% |
| Cambodians | 99.6 /100 | #42 | Exceptional 88.2% |
| Immigrants | Scotland | 99.6 /100 | #43 | Exceptional 88.2% |
| Macedonians | 99.5 /100 | #44 | Exceptional 88.1% |
| Czechs | 99.5 /100 | #45 | Exceptional 88.1% |
| Immigrants | Switzerland | 99.5 /100 | #46 | Exceptional 88.1% |
| Immigrants | Latvia | 99.5 /100 | #47 | Exceptional 88.1% |
| Greeks | 99.5 /100 | #48 | Exceptional 88.1% |
| Australians | 99.5 /100 | #49 | Exceptional 88.1% |
Demographics Similar to Marshallese by GED/Equivalency
In terms of ged/equivalency, the demographic groups most similar to Marshallese are Colombian (84.9%, a difference of 0.010%), Immigrants from Cameroon (84.9%, a difference of 0.020%), Hmong (84.9%, a difference of 0.030%), Samoan (84.9%, a difference of 0.050%), and South American (84.8%, a difference of 0.080%).
| Demographics | Rating | Rank | GED/Equivalency |
| Portuguese | 15.9 /100 | #201 | Poor 85.0% |
| Cree | 15.9 /100 | #202 | Poor 85.0% |
| Panamanians | 15.3 /100 | #203 | Poor 85.0% |
| Hawaiians | 15.2 /100 | #204 | Poor 85.0% |
| Liberians | 14.6 /100 | #205 | Poor 85.0% |
| Samoans | 13.7 /100 | #206 | Poor 84.9% |
| Hmong | 13.1 /100 | #207 | Poor 84.9% |
| Marshallese | 12.5 /100 | #208 | Poor 84.9% |
| Colombians | 12.3 /100 | #209 | Poor 84.9% |
| Immigrants | Cameroon | 12.1 /100 | #210 | Poor 84.9% |
| South Americans | 10.9 /100 | #211 | Poor 84.8% |
| Immigrants | Somalia | 10.6 /100 | #212 | Poor 84.8% |
| Immigrants | Philippines | 10.0 /100 | #213 | Poor 84.8% |
| Osage | 9.5 /100 | #214 | Tragic 84.8% |
| Peruvians | 9.2 /100 | #215 | Tragic 84.7% |