Sierra Leonean vs Marshallese GED/Equivalency
COMPARE
Sierra Leonean
Marshallese
GED/Equivalency
GED/Equivalency Comparison
Sierra Leoneans
Marshallese
86.0%
GED/EQUIVALENCY
61.8/ 100
METRIC RATING
168th/ 347
METRIC RANK
84.9%
GED/EQUIVALENCY
12.5/ 100
METRIC RATING
208th/ 347
METRIC RANK
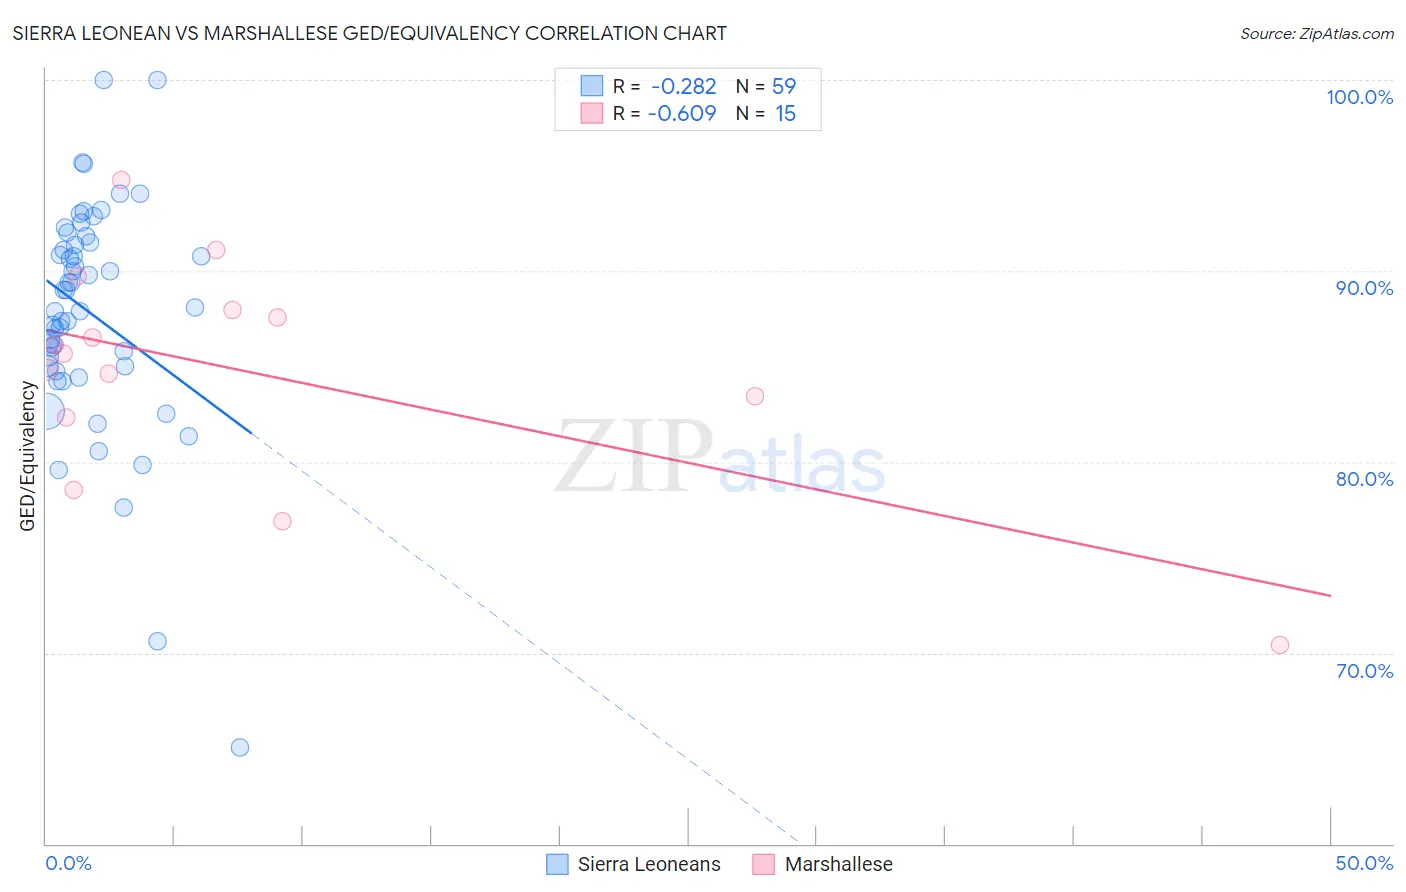
Sierra Leonean vs Marshallese GED/Equivalency Correlation Chart
The statistical analysis conducted on geographies consisting of 83,357,120 people shows a weak negative correlation between the proportion of Sierra Leoneans and percentage of population with at least ged/equivalency education in the United States with a correlation coefficient (R) of -0.282 and weighted average of 86.0%. Similarly, the statistical analysis conducted on geographies consisting of 14,760,991 people shows a significant negative correlation between the proportion of Marshallese and percentage of population with at least ged/equivalency education in the United States with a correlation coefficient (R) of -0.609 and weighted average of 84.9%, a difference of 1.3%.
GED/Equivalency Correlation Summary
| Measurement | Sierra Leonean | Marshallese |
| Minimum | 65.0% | 70.4% |
| Maximum | 100.0% | 94.8% |
| Range | 35.0% | 24.4% |
| Mean | 87.8% | 84.7% |
| Median | 88.1% | 85.7% |
| Interquartile 25% (IQ1) | 85.0% | 82.3% |
| Interquartile 75% (IQ3) | 91.5% | 88.0% |
| Interquartile Range (IQR) | 6.5% | 5.6% |
| Standard Deviation (Sample) | 6.0% | 6.0% |
| Standard Deviation (Population) | 6.0% | 5.8% |
Similar Demographics by GED/Equivalency
Demographics Similar to Sierra Leoneans by GED/Equivalency
In terms of ged/equivalency, the demographic groups most similar to Sierra Leoneans are Immigrants from Ethiopia (86.0%, a difference of 0.010%), Ethiopian (86.0%, a difference of 0.040%), Alsatian (86.0%, a difference of 0.050%), Immigrants from Albania (86.0%, a difference of 0.050%), and Afghan (85.9%, a difference of 0.050%).
| Demographics | Rating | Rank | GED/Equivalency |
| Immigrants | Syria | 69.3 /100 | #161 | Good 86.1% |
| Immigrants | Iraq | 68.1 /100 | #162 | Good 86.1% |
| Ugandans | 66.3 /100 | #163 | Good 86.1% |
| Venezuelans | 65.5 /100 | #164 | Good 86.0% |
| Alsatians | 64.3 /100 | #165 | Good 86.0% |
| Immigrants | Albania | 64.2 /100 | #166 | Good 86.0% |
| Ethiopians | 63.7 /100 | #167 | Good 86.0% |
| Sierra Leoneans | 61.8 /100 | #168 | Good 86.0% |
| Immigrants | Ethiopia | 61.2 /100 | #169 | Good 86.0% |
| Afghans | 59.7 /100 | #170 | Average 85.9% |
| Immigrants | Chile | 57.3 /100 | #171 | Average 85.9% |
| Bermudans | 55.1 /100 | #172 | Average 85.8% |
| Immigrants | Venezuela | 50.7 /100 | #173 | Average 85.8% |
| Ottawa | 50.0 /100 | #174 | Average 85.8% |
| Immigrants | Bolivia | 49.8 /100 | #175 | Average 85.8% |
Demographics Similar to Marshallese by GED/Equivalency
In terms of ged/equivalency, the demographic groups most similar to Marshallese are Colombian (84.9%, a difference of 0.010%), Immigrants from Cameroon (84.9%, a difference of 0.020%), Hmong (84.9%, a difference of 0.030%), Samoan (84.9%, a difference of 0.050%), and South American (84.8%, a difference of 0.080%).
| Demographics | Rating | Rank | GED/Equivalency |
| Portuguese | 15.9 /100 | #201 | Poor 85.0% |
| Cree | 15.9 /100 | #202 | Poor 85.0% |
| Panamanians | 15.3 /100 | #203 | Poor 85.0% |
| Hawaiians | 15.2 /100 | #204 | Poor 85.0% |
| Liberians | 14.6 /100 | #205 | Poor 85.0% |
| Samoans | 13.7 /100 | #206 | Poor 84.9% |
| Hmong | 13.1 /100 | #207 | Poor 84.9% |
| Marshallese | 12.5 /100 | #208 | Poor 84.9% |
| Colombians | 12.3 /100 | #209 | Poor 84.9% |
| Immigrants | Cameroon | 12.1 /100 | #210 | Poor 84.9% |
| South Americans | 10.9 /100 | #211 | Poor 84.8% |
| Immigrants | Somalia | 10.6 /100 | #212 | Poor 84.8% |
| Immigrants | Philippines | 10.0 /100 | #213 | Poor 84.8% |
| Osage | 9.5 /100 | #214 | Tragic 84.8% |
| Peruvians | 9.2 /100 | #215 | Tragic 84.7% |