Alaskan Athabascan vs Immigrants from Uganda College, Under 1 year
COMPARE
Alaskan Athabascan
Immigrants from Uganda
College, Under 1 year
College, Under 1 year Comparison
Alaskan Athabascans
Immigrants from Uganda
61.0%
COLLEGE, UNDER 1 YEAR
0.2/ 100
METRIC RATING
266th/ 347
METRIC RANK
66.5%
COLLEGE, UNDER 1 YEAR
82.8/ 100
METRIC RATING
143rd/ 347
METRIC RANK
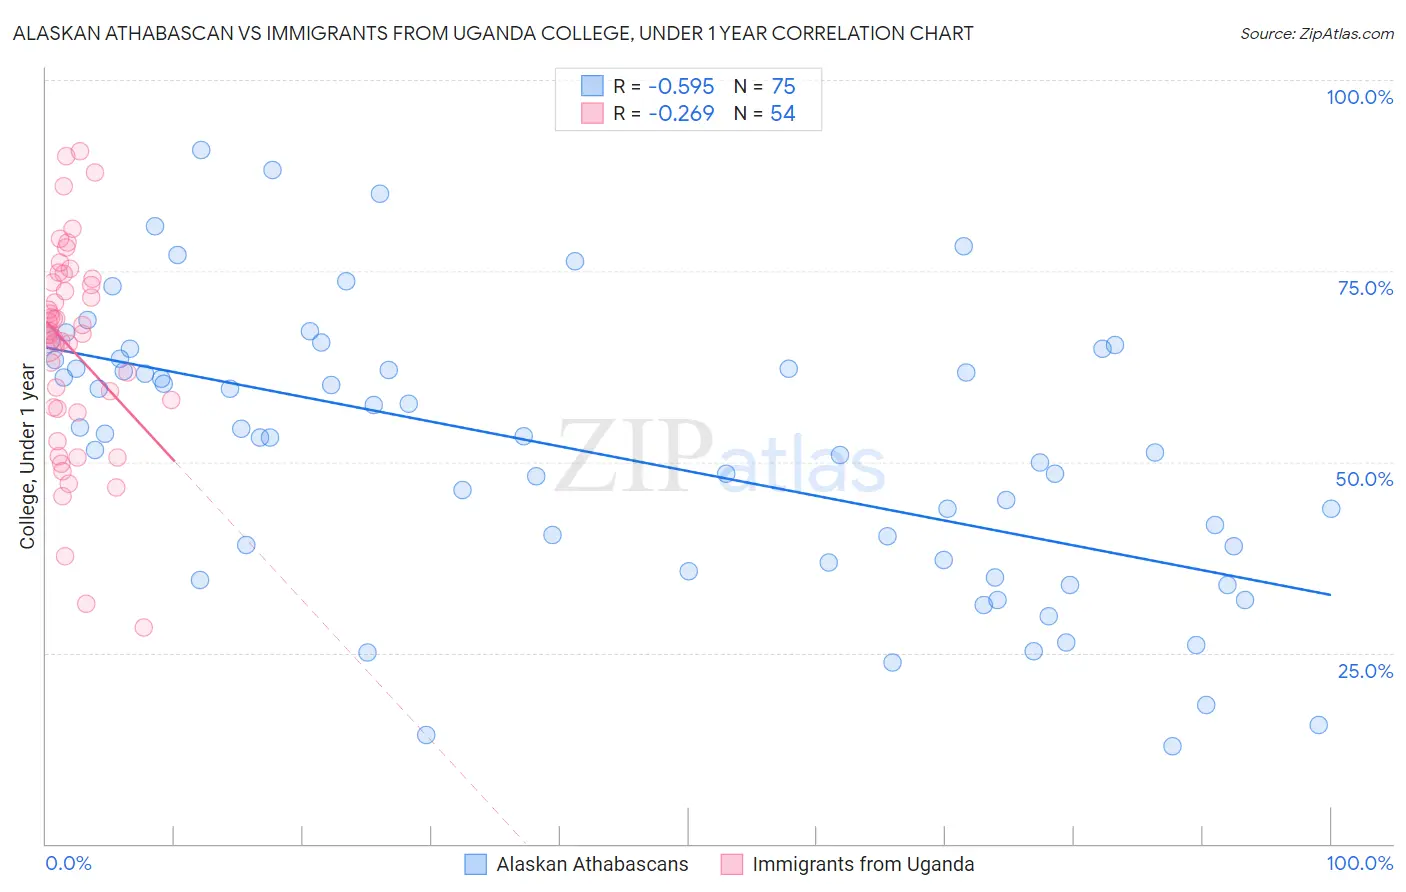
Alaskan Athabascan vs Immigrants from Uganda College, Under 1 year Correlation Chart
The statistical analysis conducted on geographies consisting of 45,820,412 people shows a substantial negative correlation between the proportion of Alaskan Athabascans and percentage of population with at least college, under 1 year education in the United States with a correlation coefficient (R) of -0.595 and weighted average of 61.0%. Similarly, the statistical analysis conducted on geographies consisting of 125,982,535 people shows a weak negative correlation between the proportion of Immigrants from Uganda and percentage of population with at least college, under 1 year education in the United States with a correlation coefficient (R) of -0.269 and weighted average of 66.5%, a difference of 9.1%.
College, Under 1 year Correlation Summary
| Measurement | Alaskan Athabascan | Immigrants from Uganda |
| Minimum | 12.7% | 28.3% |
| Maximum | 90.8% | 90.7% |
| Range | 78.1% | 62.4% |
| Mean | 51.2% | 64.8% |
| Median | 53.2% | 66.8% |
| Interquartile 25% (IQ1) | 36.8% | 57.0% |
| Interquartile 75% (IQ3) | 63.4% | 73.5% |
| Interquartile Range (IQR) | 26.5% | 16.6% |
| Standard Deviation (Sample) | 18.1% | 13.6% |
| Standard Deviation (Population) | 18.0% | 13.5% |
Similar Demographics by College, Under 1 year
Demographics Similar to Alaskan Athabascans by College, Under 1 year
In terms of college, under 1 year, the demographic groups most similar to Alaskan Athabascans are American (61.0%, a difference of 0.010%), Trinidadian and Tobagonian (61.1%, a difference of 0.12%), Immigrants from Bahamas (61.1%, a difference of 0.12%), Barbadian (61.1%, a difference of 0.18%), and Shoshone (61.1%, a difference of 0.18%).
| Demographics | Rating | Rank | College, Under 1 year |
| Indonesians | 0.3 /100 | #259 | Tragic 61.2% |
| Blackfeet | 0.3 /100 | #260 | Tragic 61.1% |
| Africans | 0.3 /100 | #261 | Tragic 61.1% |
| Barbadians | 0.2 /100 | #262 | Tragic 61.1% |
| Shoshone | 0.2 /100 | #263 | Tragic 61.1% |
| Trinidadians and Tobagonians | 0.2 /100 | #264 | Tragic 61.1% |
| Immigrants | Bahamas | 0.2 /100 | #265 | Tragic 61.1% |
| Alaskan Athabascans | 0.2 /100 | #266 | Tragic 61.0% |
| Americans | 0.2 /100 | #267 | Tragic 61.0% |
| Immigrants | Trinidad and Tobago | 0.1 /100 | #268 | Tragic 60.7% |
| Immigrants | West Indies | 0.1 /100 | #269 | Tragic 60.6% |
| Cheyenne | 0.1 /100 | #270 | Tragic 60.6% |
| U.S. Virgin Islanders | 0.1 /100 | #271 | Tragic 60.6% |
| Jamaicans | 0.1 /100 | #272 | Tragic 60.5% |
| Chickasaw | 0.1 /100 | #273 | Tragic 60.4% |
Demographics Similar to Immigrants from Uganda by College, Under 1 year
In terms of college, under 1 year, the demographic groups most similar to Immigrants from Uganda are English (66.6%, a difference of 0.010%), Immigrants from Germany (66.5%, a difference of 0.060%), Immigrants from Kenya (66.5%, a difference of 0.070%), Kenyan (66.5%, a difference of 0.080%), and Immigrants from Morocco (66.5%, a difference of 0.080%).
| Demographics | Rating | Rank | College, Under 1 year |
| Ugandans | 87.8 /100 | #136 | Excellent 66.8% |
| Immigrants | Chile | 87.4 /100 | #137 | Excellent 66.8% |
| Immigrants | Italy | 86.9 /100 | #138 | Excellent 66.8% |
| Venezuelans | 85.9 /100 | #139 | Excellent 66.7% |
| Slavs | 85.9 /100 | #140 | Excellent 66.7% |
| Immigrants | Afghanistan | 85.1 /100 | #141 | Excellent 66.7% |
| English | 82.9 /100 | #142 | Excellent 66.6% |
| Immigrants | Uganda | 82.8 /100 | #143 | Excellent 66.5% |
| Immigrants | Germany | 82.0 /100 | #144 | Excellent 66.5% |
| Immigrants | Kenya | 81.8 /100 | #145 | Excellent 66.5% |
| Kenyans | 81.7 /100 | #146 | Excellent 66.5% |
| Immigrants | Morocco | 81.7 /100 | #147 | Excellent 66.5% |
| Taiwanese | 78.6 /100 | #148 | Good 66.4% |
| Immigrants | Venezuela | 77.9 /100 | #149 | Good 66.3% |
| Immigrants | Iraq | 77.1 /100 | #150 | Good 66.3% |