Alaskan Athabascan vs Uruguayan College, Under 1 year
COMPARE
Alaskan Athabascan
Uruguayan
College, Under 1 year
College, Under 1 year Comparison
Alaskan Athabascans
Uruguayans
61.0%
COLLEGE, UNDER 1 YEAR
0.2/ 100
METRIC RATING
266th/ 347
METRIC RANK
64.2%
COLLEGE, UNDER 1 YEAR
15.6/ 100
METRIC RATING
203rd/ 347
METRIC RANK
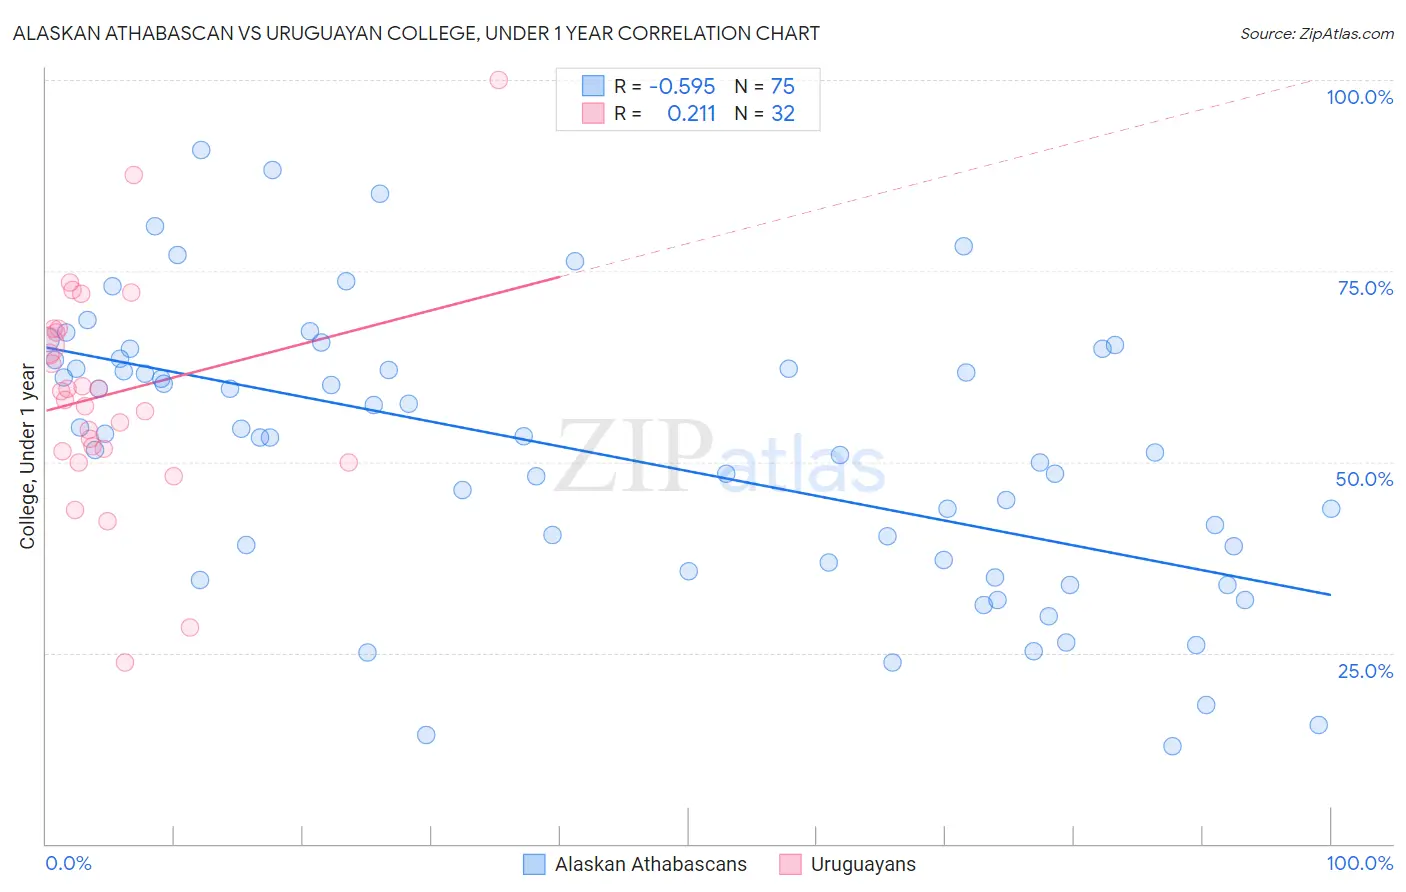
Alaskan Athabascan vs Uruguayan College, Under 1 year Correlation Chart
The statistical analysis conducted on geographies consisting of 45,820,412 people shows a substantial negative correlation between the proportion of Alaskan Athabascans and percentage of population with at least college, under 1 year education in the United States with a correlation coefficient (R) of -0.595 and weighted average of 61.0%. Similarly, the statistical analysis conducted on geographies consisting of 144,782,794 people shows a weak positive correlation between the proportion of Uruguayans and percentage of population with at least college, under 1 year education in the United States with a correlation coefficient (R) of 0.211 and weighted average of 64.2%, a difference of 5.3%.
College, Under 1 year Correlation Summary
| Measurement | Alaskan Athabascan | Uruguayan |
| Minimum | 12.7% | 23.7% |
| Maximum | 90.8% | 100.0% |
| Range | 78.1% | 76.2% |
| Mean | 51.2% | 58.9% |
| Median | 53.2% | 58.7% |
| Interquartile 25% (IQ1) | 36.8% | 51.6% |
| Interquartile 75% (IQ3) | 63.4% | 67.2% |
| Interquartile Range (IQR) | 26.5% | 15.6% |
| Standard Deviation (Sample) | 18.1% | 14.8% |
| Standard Deviation (Population) | 18.0% | 14.5% |
Similar Demographics by College, Under 1 year
Demographics Similar to Alaskan Athabascans by College, Under 1 year
In terms of college, under 1 year, the demographic groups most similar to Alaskan Athabascans are American (61.0%, a difference of 0.010%), Trinidadian and Tobagonian (61.1%, a difference of 0.12%), Immigrants from Bahamas (61.1%, a difference of 0.12%), Barbadian (61.1%, a difference of 0.18%), and Shoshone (61.1%, a difference of 0.18%).
| Demographics | Rating | Rank | College, Under 1 year |
| Indonesians | 0.3 /100 | #259 | Tragic 61.2% |
| Blackfeet | 0.3 /100 | #260 | Tragic 61.1% |
| Africans | 0.3 /100 | #261 | Tragic 61.1% |
| Barbadians | 0.2 /100 | #262 | Tragic 61.1% |
| Shoshone | 0.2 /100 | #263 | Tragic 61.1% |
| Trinidadians and Tobagonians | 0.2 /100 | #264 | Tragic 61.1% |
| Immigrants | Bahamas | 0.2 /100 | #265 | Tragic 61.1% |
| Alaskan Athabascans | 0.2 /100 | #266 | Tragic 61.0% |
| Americans | 0.2 /100 | #267 | Tragic 61.0% |
| Immigrants | Trinidad and Tobago | 0.1 /100 | #268 | Tragic 60.7% |
| Immigrants | West Indies | 0.1 /100 | #269 | Tragic 60.6% |
| Cheyenne | 0.1 /100 | #270 | Tragic 60.6% |
| U.S. Virgin Islanders | 0.1 /100 | #271 | Tragic 60.6% |
| Jamaicans | 0.1 /100 | #272 | Tragic 60.5% |
| Chickasaw | 0.1 /100 | #273 | Tragic 60.4% |
Demographics Similar to Uruguayans by College, Under 1 year
In terms of college, under 1 year, the demographic groups most similar to Uruguayans are French Canadian (64.2%, a difference of 0.050%), South American (64.2%, a difference of 0.050%), Nigerian (64.3%, a difference of 0.090%), Immigrants from Zaire (64.1%, a difference of 0.090%), and Panamanian (64.3%, a difference of 0.11%).
| Demographics | Rating | Rank | College, Under 1 year |
| Tongans | 21.2 /100 | #196 | Fair 64.5% |
| Costa Ricans | 19.6 /100 | #197 | Poor 64.4% |
| Tsimshian | 17.9 /100 | #198 | Poor 64.3% |
| Panamanians | 17.0 /100 | #199 | Poor 64.3% |
| Nigerians | 16.7 /100 | #200 | Poor 64.3% |
| French Canadians | 16.3 /100 | #201 | Poor 64.2% |
| South Americans | 16.2 /100 | #202 | Poor 64.2% |
| Uruguayans | 15.6 /100 | #203 | Poor 64.2% |
| Immigrants | Zaire | 14.6 /100 | #204 | Poor 64.1% |
| Peruvians | 13.7 /100 | #205 | Poor 64.1% |
| Whites/Caucasians | 12.8 /100 | #206 | Poor 64.0% |
| Colombians | 12.4 /100 | #207 | Poor 64.0% |
| Immigrants | Vietnam | 12.1 /100 | #208 | Poor 64.0% |
| Puget Sound Salish | 11.3 /100 | #209 | Poor 63.9% |
| Ghanaians | 11.2 /100 | #210 | Poor 63.9% |