Alaskan Athabascan vs Immigrants from Uganda Median Female Earnings
COMPARE
Alaskan Athabascan
Immigrants from Uganda
Median Female Earnings
Median Female Earnings Comparison
Alaskan Athabascans
Immigrants from Uganda
$37,905
MEDIAN FEMALE EARNINGS
2.3/ 100
METRIC RATING
248th/ 347
METRIC RANK
$40,739
MEDIAN FEMALE EARNINGS
89.7/ 100
METRIC RATING
132nd/ 347
METRIC RANK
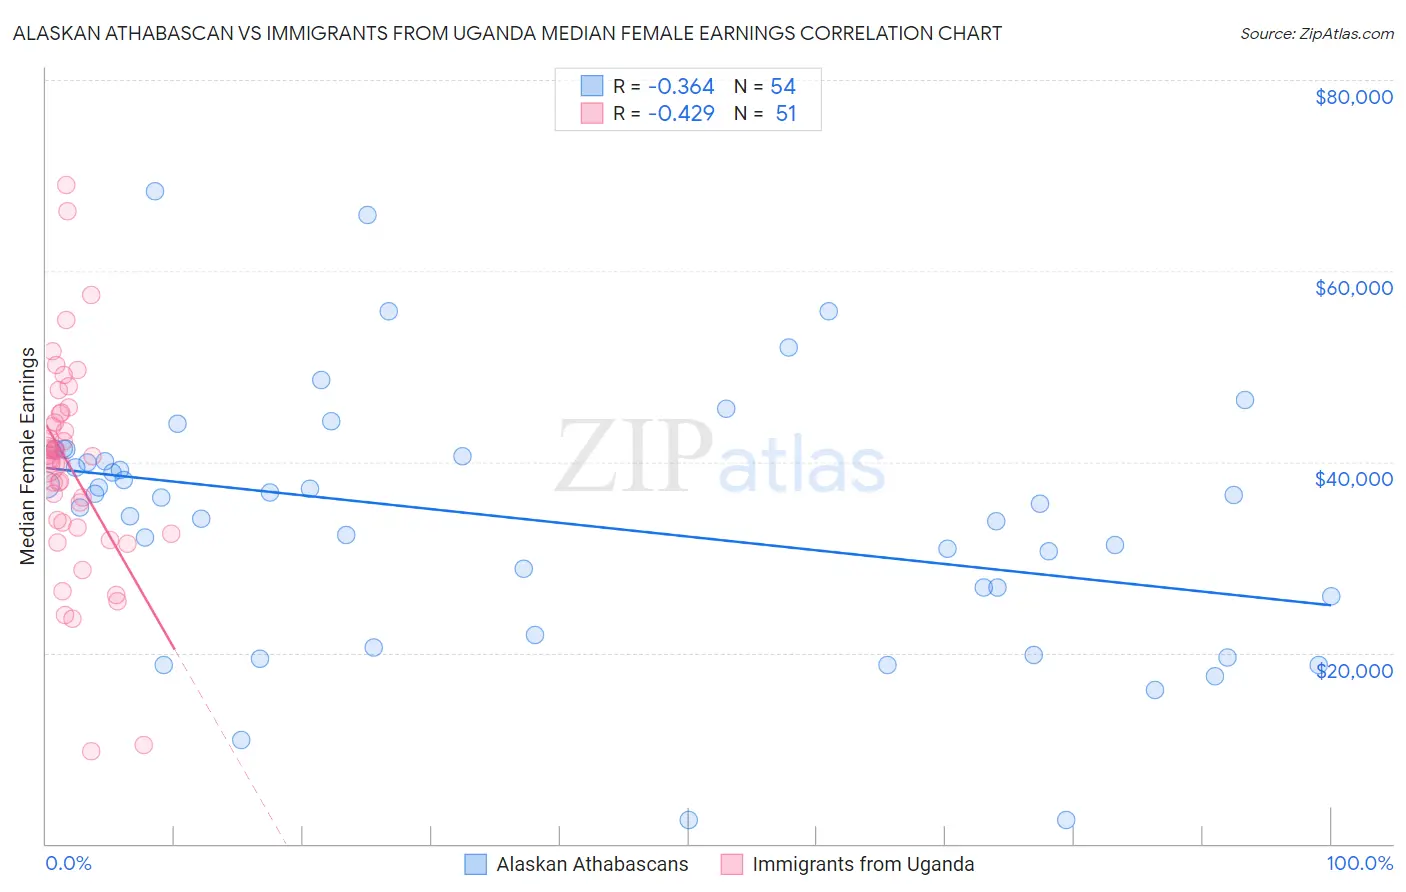
Alaskan Athabascan vs Immigrants from Uganda Median Female Earnings Correlation Chart
The statistical analysis conducted on geographies consisting of 45,800,514 people shows a mild negative correlation between the proportion of Alaskan Athabascans and median female earnings in the United States with a correlation coefficient (R) of -0.364 and weighted average of $37,905. Similarly, the statistical analysis conducted on geographies consisting of 125,969,564 people shows a moderate negative correlation between the proportion of Immigrants from Uganda and median female earnings in the United States with a correlation coefficient (R) of -0.429 and weighted average of $40,739, a difference of 7.5%.
Median Female Earnings Correlation Summary
| Measurement | Alaskan Athabascan | Immigrants from Uganda |
| Minimum | $2,499 | $9,732 |
| Maximum | $68,290 | $69,004 |
| Range | $65,791 | $59,272 |
| Mean | $33,896 | $39,368 |
| Median | $35,954 | $40,305 |
| Interquartile 25% (IQ1) | $25,923 | $33,173 |
| Interquartile 75% (IQ3) | $40,625 | $44,985 |
| Interquartile Range (IQR) | $14,702 | $11,812 |
| Standard Deviation (Sample) | $13,459 | $11,139 |
| Standard Deviation (Population) | $13,333 | $11,029 |
Similar Demographics by Median Female Earnings
Demographics Similar to Alaskan Athabascans by Median Female Earnings
In terms of median female earnings, the demographic groups most similar to Alaskan Athabascans are Swiss ($37,904, a difference of 0.0%), Immigrants from Somalia ($37,914, a difference of 0.020%), Immigrants from Iraq ($37,864, a difference of 0.11%), Welsh ($37,856, a difference of 0.13%), and Immigrants from Middle Africa ($37,965, a difference of 0.16%).
| Demographics | Rating | Rank | Median Female Earnings |
| Spanish | 3.5 /100 | #241 | Tragic $38,098 |
| Immigrants | Burma/Myanmar | 3.0 /100 | #242 | Tragic $38,028 |
| Germans | 2.8 /100 | #243 | Tragic $37,986 |
| Immigrants | Liberia | 2.7 /100 | #244 | Tragic $37,970 |
| Immigrants | Middle Africa | 2.7 /100 | #245 | Tragic $37,965 |
| Delaware | 2.6 /100 | #246 | Tragic $37,964 |
| Immigrants | Somalia | 2.4 /100 | #247 | Tragic $37,914 |
| Alaskan Athabascans | 2.3 /100 | #248 | Tragic $37,905 |
| Swiss | 2.3 /100 | #249 | Tragic $37,904 |
| Immigrants | Iraq | 2.2 /100 | #250 | Tragic $37,864 |
| Welsh | 2.1 /100 | #251 | Tragic $37,856 |
| Immigrants | Dominica | 2.0 /100 | #252 | Tragic $37,825 |
| Danes | 1.6 /100 | #253 | Tragic $37,730 |
| Whites/Caucasians | 1.1 /100 | #254 | Tragic $37,531 |
| Colville | 1.1 /100 | #255 | Tragic $37,514 |
Demographics Similar to Immigrants from Uganda by Median Female Earnings
In terms of median female earnings, the demographic groups most similar to Immigrants from Uganda are Syrian ($40,727, a difference of 0.030%), Chilean ($40,757, a difference of 0.040%), Arab ($40,718, a difference of 0.050%), Immigrants from Guyana ($40,773, a difference of 0.080%), and Immigrants from Nepal ($40,704, a difference of 0.090%).
| Demographics | Rating | Rank | Median Female Earnings |
| Austrians | 92.7 /100 | #125 | Exceptional $40,923 |
| Immigrants | Trinidad and Tobago | 92.3 /100 | #126 | Exceptional $40,895 |
| Ugandans | 92.2 /100 | #127 | Exceptional $40,889 |
| Carpatho Rusyns | 91.2 /100 | #128 | Exceptional $40,825 |
| Zimbabweans | 90.8 /100 | #129 | Exceptional $40,798 |
| Immigrants | Guyana | 90.3 /100 | #130 | Exceptional $40,773 |
| Chileans | 90.0 /100 | #131 | Exceptional $40,757 |
| Immigrants | Uganda | 89.7 /100 | #132 | Excellent $40,739 |
| Syrians | 89.5 /100 | #133 | Excellent $40,727 |
| Arabs | 89.3 /100 | #134 | Excellent $40,718 |
| Immigrants | Nepal | 89.0 /100 | #135 | Excellent $40,704 |
| Immigrants | Eastern Africa | 87.7 /100 | #136 | Excellent $40,644 |
| Pakistanis | 86.6 /100 | #137 | Excellent $40,596 |
| Taiwanese | 86.1 /100 | #138 | Excellent $40,576 |
| Immigrants | South Eastern Asia | 85.7 /100 | #139 | Excellent $40,558 |