Malaysian vs Immigrants from Uganda College, Under 1 year
COMPARE
Malaysian
Immigrants from Uganda
College, Under 1 year
College, Under 1 year Comparison
Malaysians
Immigrants from Uganda
62.2%
COLLEGE, UNDER 1 YEAR
1.1/ 100
METRIC RATING
242nd/ 347
METRIC RANK
66.5%
COLLEGE, UNDER 1 YEAR
82.8/ 100
METRIC RATING
143rd/ 347
METRIC RANK
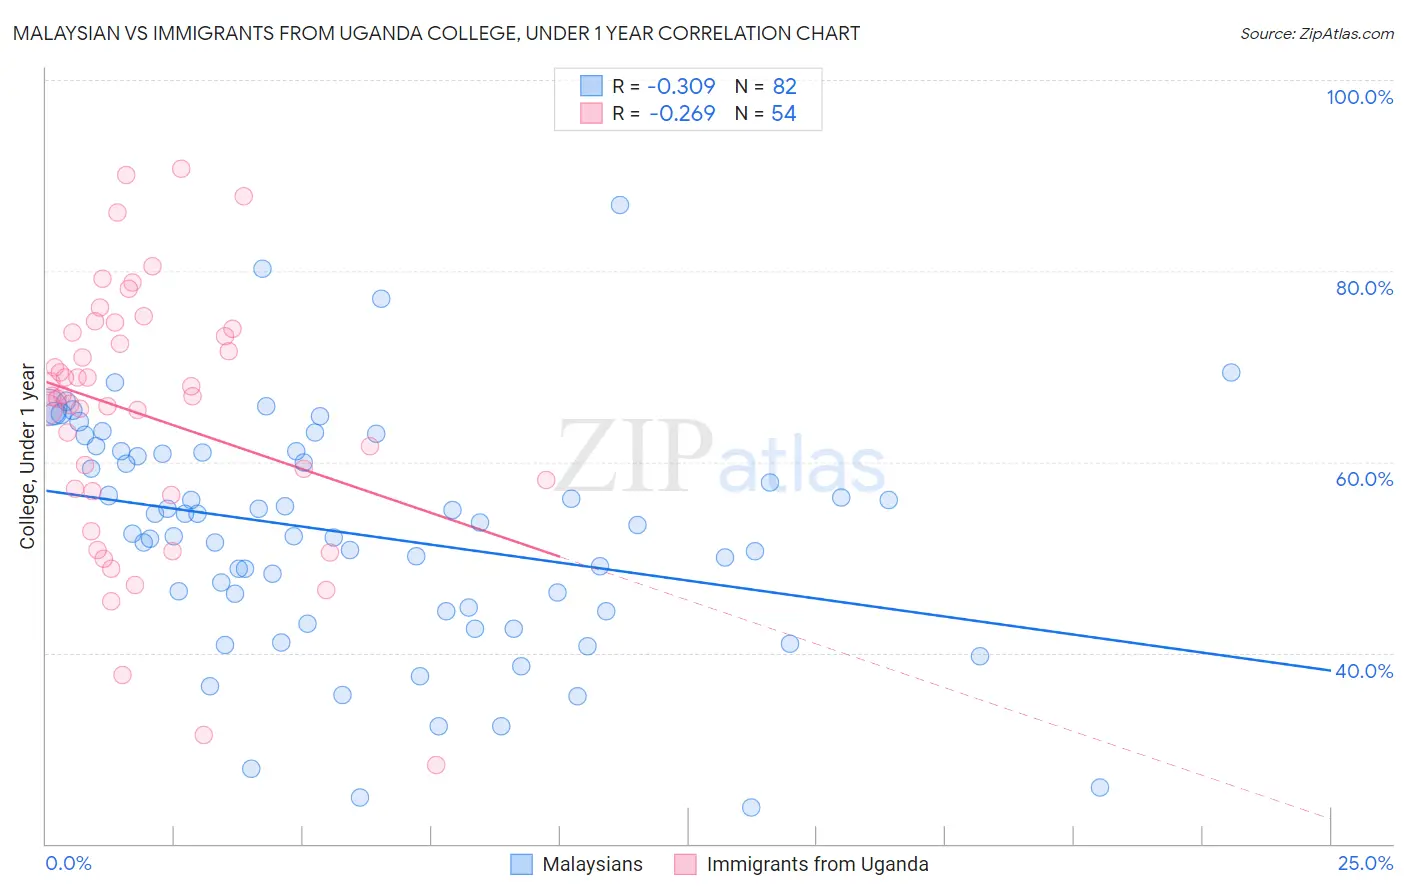
Malaysian vs Immigrants from Uganda College, Under 1 year Correlation Chart
The statistical analysis conducted on geographies consisting of 226,109,118 people shows a mild negative correlation between the proportion of Malaysians and percentage of population with at least college, under 1 year education in the United States with a correlation coefficient (R) of -0.309 and weighted average of 62.2%. Similarly, the statistical analysis conducted on geographies consisting of 125,982,535 people shows a weak negative correlation between the proportion of Immigrants from Uganda and percentage of population with at least college, under 1 year education in the United States with a correlation coefficient (R) of -0.269 and weighted average of 66.5%, a difference of 7.0%.
College, Under 1 year Correlation Summary
| Measurement | Malaysian | Immigrants from Uganda |
| Minimum | 23.8% | 28.3% |
| Maximum | 86.9% | 90.7% |
| Range | 63.2% | 62.4% |
| Mean | 52.4% | 64.8% |
| Median | 53.0% | 66.8% |
| Interquartile 25% (IQ1) | 44.4% | 57.0% |
| Interquartile 75% (IQ3) | 60.9% | 73.5% |
| Interquartile Range (IQR) | 16.6% | 16.6% |
| Standard Deviation (Sample) | 12.1% | 13.6% |
| Standard Deviation (Population) | 12.1% | 13.5% |
Similar Demographics by College, Under 1 year
Demographics Similar to Malaysians by College, Under 1 year
In terms of college, under 1 year, the demographic groups most similar to Malaysians are Hawaiian (62.1%, a difference of 0.030%), Ottawa (62.2%, a difference of 0.050%), Nepalese (62.2%, a difference of 0.060%), Aleut (62.2%, a difference of 0.060%), and Colville (62.1%, a difference of 0.12%).
| Demographics | Rating | Rank | College, Under 1 year |
| Spanish Americans | 1.9 /100 | #235 | Tragic 62.6% |
| Immigrants | Immigrants | 1.7 /100 | #236 | Tragic 62.5% |
| Immigrants | Burma/Myanmar | 1.6 /100 | #237 | Tragic 62.5% |
| French American Indians | 1.5 /100 | #238 | Tragic 62.4% |
| Nepalese | 1.1 /100 | #239 | Tragic 62.2% |
| Aleuts | 1.1 /100 | #240 | Tragic 62.2% |
| Ottawa | 1.1 /100 | #241 | Tragic 62.2% |
| Malaysians | 1.1 /100 | #242 | Tragic 62.2% |
| Hawaiians | 1.1 /100 | #243 | Tragic 62.1% |
| Colville | 1.0 /100 | #244 | Tragic 62.1% |
| Delaware | 0.9 /100 | #245 | Tragic 62.1% |
| Marshallese | 0.8 /100 | #246 | Tragic 61.9% |
| Immigrants | Liberia | 0.8 /100 | #247 | Tragic 61.9% |
| Potawatomi | 0.6 /100 | #248 | Tragic 61.8% |
| Vietnamese | 0.5 /100 | #249 | Tragic 61.7% |
Demographics Similar to Immigrants from Uganda by College, Under 1 year
In terms of college, under 1 year, the demographic groups most similar to Immigrants from Uganda are English (66.6%, a difference of 0.010%), Immigrants from Germany (66.5%, a difference of 0.060%), Immigrants from Kenya (66.5%, a difference of 0.070%), Kenyan (66.5%, a difference of 0.080%), and Immigrants from Morocco (66.5%, a difference of 0.080%).
| Demographics | Rating | Rank | College, Under 1 year |
| Ugandans | 87.8 /100 | #136 | Excellent 66.8% |
| Immigrants | Chile | 87.4 /100 | #137 | Excellent 66.8% |
| Immigrants | Italy | 86.9 /100 | #138 | Excellent 66.8% |
| Venezuelans | 85.9 /100 | #139 | Excellent 66.7% |
| Slavs | 85.9 /100 | #140 | Excellent 66.7% |
| Immigrants | Afghanistan | 85.1 /100 | #141 | Excellent 66.7% |
| English | 82.9 /100 | #142 | Excellent 66.6% |
| Immigrants | Uganda | 82.8 /100 | #143 | Excellent 66.5% |
| Immigrants | Germany | 82.0 /100 | #144 | Excellent 66.5% |
| Immigrants | Kenya | 81.8 /100 | #145 | Excellent 66.5% |
| Kenyans | 81.7 /100 | #146 | Excellent 66.5% |
| Immigrants | Morocco | 81.7 /100 | #147 | Excellent 66.5% |
| Taiwanese | 78.6 /100 | #148 | Good 66.4% |
| Immigrants | Venezuela | 77.9 /100 | #149 | Good 66.3% |
| Immigrants | Iraq | 77.1 /100 | #150 | Good 66.3% |