Alaskan Athabascan vs Immigrants from South Central Asia College, Under 1 year
COMPARE
Alaskan Athabascan
Immigrants from South Central Asia
College, Under 1 year
College, Under 1 year Comparison
Alaskan Athabascans
Immigrants from South Central Asia
61.0%
COLLEGE, UNDER 1 YEAR
0.2/ 100
METRIC RATING
266th/ 347
METRIC RANK
72.1%
COLLEGE, UNDER 1 YEAR
100.0/ 100
METRIC RATING
11th/ 347
METRIC RANK
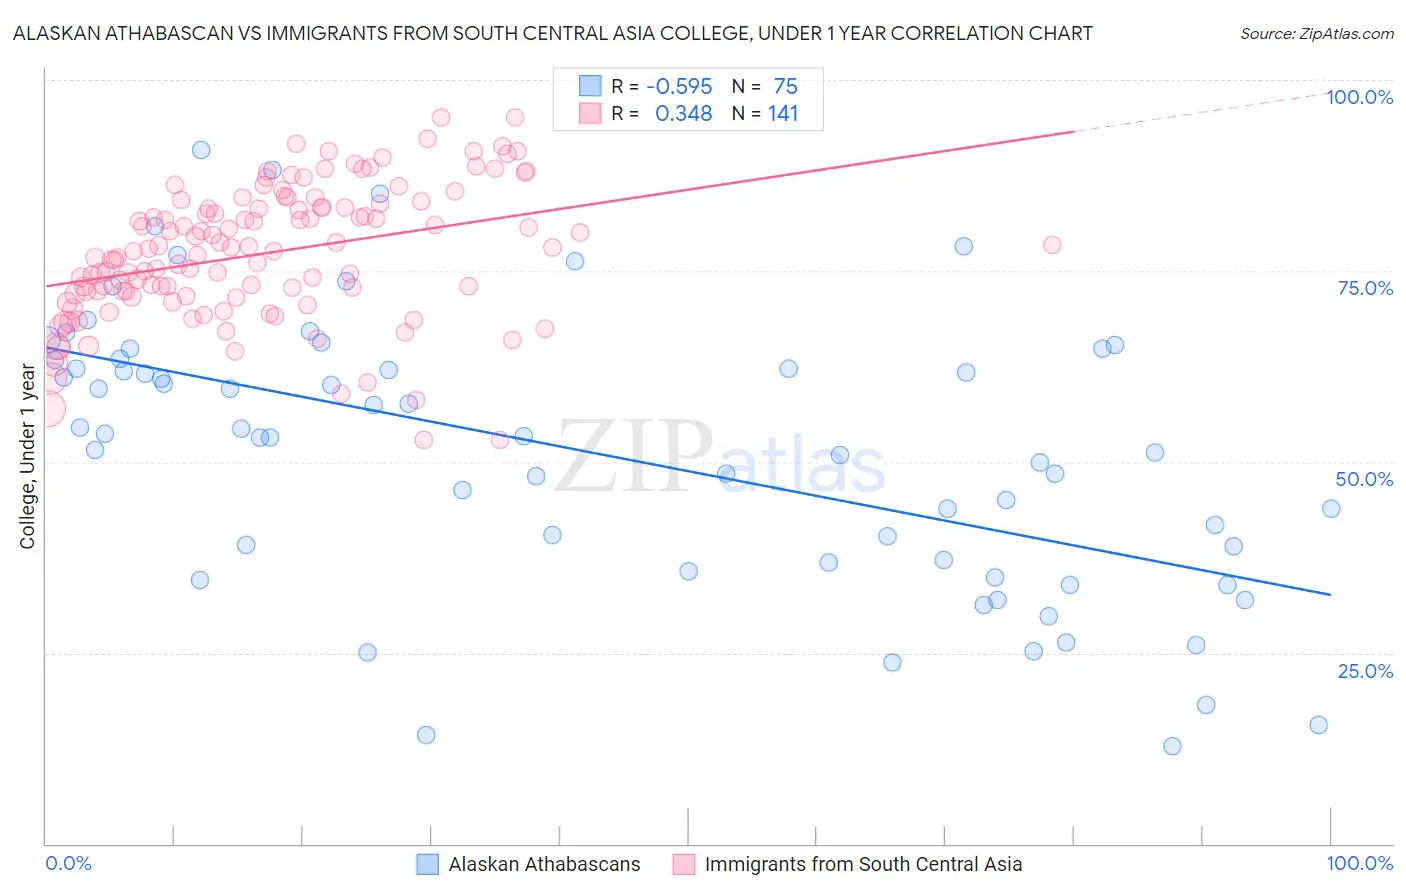
Alaskan Athabascan vs Immigrants from South Central Asia College, Under 1 year Correlation Chart
The statistical analysis conducted on geographies consisting of 45,820,412 people shows a substantial negative correlation between the proportion of Alaskan Athabascans and percentage of population with at least college, under 1 year education in the United States with a correlation coefficient (R) of -0.595 and weighted average of 61.0%. Similarly, the statistical analysis conducted on geographies consisting of 473,110,045 people shows a mild positive correlation between the proportion of Immigrants from South Central Asia and percentage of population with at least college, under 1 year education in the United States with a correlation coefficient (R) of 0.348 and weighted average of 72.1%, a difference of 18.2%.
College, Under 1 year Correlation Summary
| Measurement | Alaskan Athabascan | Immigrants from South Central Asia |
| Minimum | 12.7% | 52.9% |
| Maximum | 90.8% | 95.2% |
| Range | 78.1% | 42.3% |
| Mean | 51.2% | 77.3% |
| Median | 53.2% | 77.6% |
| Interquartile 25% (IQ1) | 36.8% | 71.8% |
| Interquartile 75% (IQ3) | 63.4% | 83.3% |
| Interquartile Range (IQR) | 26.5% | 11.5% |
| Standard Deviation (Sample) | 18.1% | 8.7% |
| Standard Deviation (Population) | 18.0% | 8.7% |
Similar Demographics by College, Under 1 year
Demographics Similar to Alaskan Athabascans by College, Under 1 year
In terms of college, under 1 year, the demographic groups most similar to Alaskan Athabascans are American (61.0%, a difference of 0.010%), Trinidadian and Tobagonian (61.1%, a difference of 0.12%), Immigrants from Bahamas (61.1%, a difference of 0.12%), Barbadian (61.1%, a difference of 0.18%), and Shoshone (61.1%, a difference of 0.18%).
| Demographics | Rating | Rank | College, Under 1 year |
| Indonesians | 0.3 /100 | #259 | Tragic 61.2% |
| Blackfeet | 0.3 /100 | #260 | Tragic 61.1% |
| Africans | 0.3 /100 | #261 | Tragic 61.1% |
| Barbadians | 0.2 /100 | #262 | Tragic 61.1% |
| Shoshone | 0.2 /100 | #263 | Tragic 61.1% |
| Trinidadians and Tobagonians | 0.2 /100 | #264 | Tragic 61.1% |
| Immigrants | Bahamas | 0.2 /100 | #265 | Tragic 61.1% |
| Alaskan Athabascans | 0.2 /100 | #266 | Tragic 61.0% |
| Americans | 0.2 /100 | #267 | Tragic 61.0% |
| Immigrants | Trinidad and Tobago | 0.1 /100 | #268 | Tragic 60.7% |
| Immigrants | West Indies | 0.1 /100 | #269 | Tragic 60.6% |
| Cheyenne | 0.1 /100 | #270 | Tragic 60.6% |
| U.S. Virgin Islanders | 0.1 /100 | #271 | Tragic 60.6% |
| Jamaicans | 0.1 /100 | #272 | Tragic 60.5% |
| Chickasaw | 0.1 /100 | #273 | Tragic 60.4% |
Demographics Similar to Immigrants from South Central Asia by College, Under 1 year
In terms of college, under 1 year, the demographic groups most similar to Immigrants from South Central Asia are Immigrants from Sweden (72.1%, a difference of 0.0%), Cypriot (72.0%, a difference of 0.16%), Cambodian (71.9%, a difference of 0.28%), Burmese (71.9%, a difference of 0.28%), and Immigrants from Japan (71.9%, a difference of 0.29%).
| Demographics | Rating | Rank | College, Under 1 year |
| Immigrants | India | 100.0 /100 | #4 | Exceptional 74.4% |
| Immigrants | Iran | 100.0 /100 | #5 | Exceptional 74.3% |
| Immigrants | Taiwan | 100.0 /100 | #6 | Exceptional 74.2% |
| Okinawans | 100.0 /100 | #7 | Exceptional 73.7% |
| Thais | 100.0 /100 | #8 | Exceptional 73.4% |
| Immigrants | Australia | 100.0 /100 | #9 | Exceptional 72.7% |
| Immigrants | Israel | 100.0 /100 | #10 | Exceptional 72.3% |
| Immigrants | South Central Asia | 100.0 /100 | #11 | Exceptional 72.1% |
| Immigrants | Sweden | 100.0 /100 | #12 | Exceptional 72.1% |
| Cypriots | 100.0 /100 | #13 | Exceptional 72.0% |
| Cambodians | 100.0 /100 | #14 | Exceptional 71.9% |
| Burmese | 100.0 /100 | #15 | Exceptional 71.9% |
| Immigrants | Japan | 100.0 /100 | #16 | Exceptional 71.9% |
| Eastern Europeans | 100.0 /100 | #17 | Exceptional 71.8% |
| Immigrants | Switzerland | 100.0 /100 | #18 | Exceptional 71.7% |