Alaskan Athabascan vs Jordanian College, Under 1 year
COMPARE
Alaskan Athabascan
Jordanian
College, Under 1 year
College, Under 1 year Comparison
Alaskan Athabascans
Jordanians
61.0%
COLLEGE, UNDER 1 YEAR
0.2/ 100
METRIC RATING
266th/ 347
METRIC RANK
68.0%
COLLEGE, UNDER 1 YEAR
97.4/ 100
METRIC RATING
96th/ 347
METRIC RANK
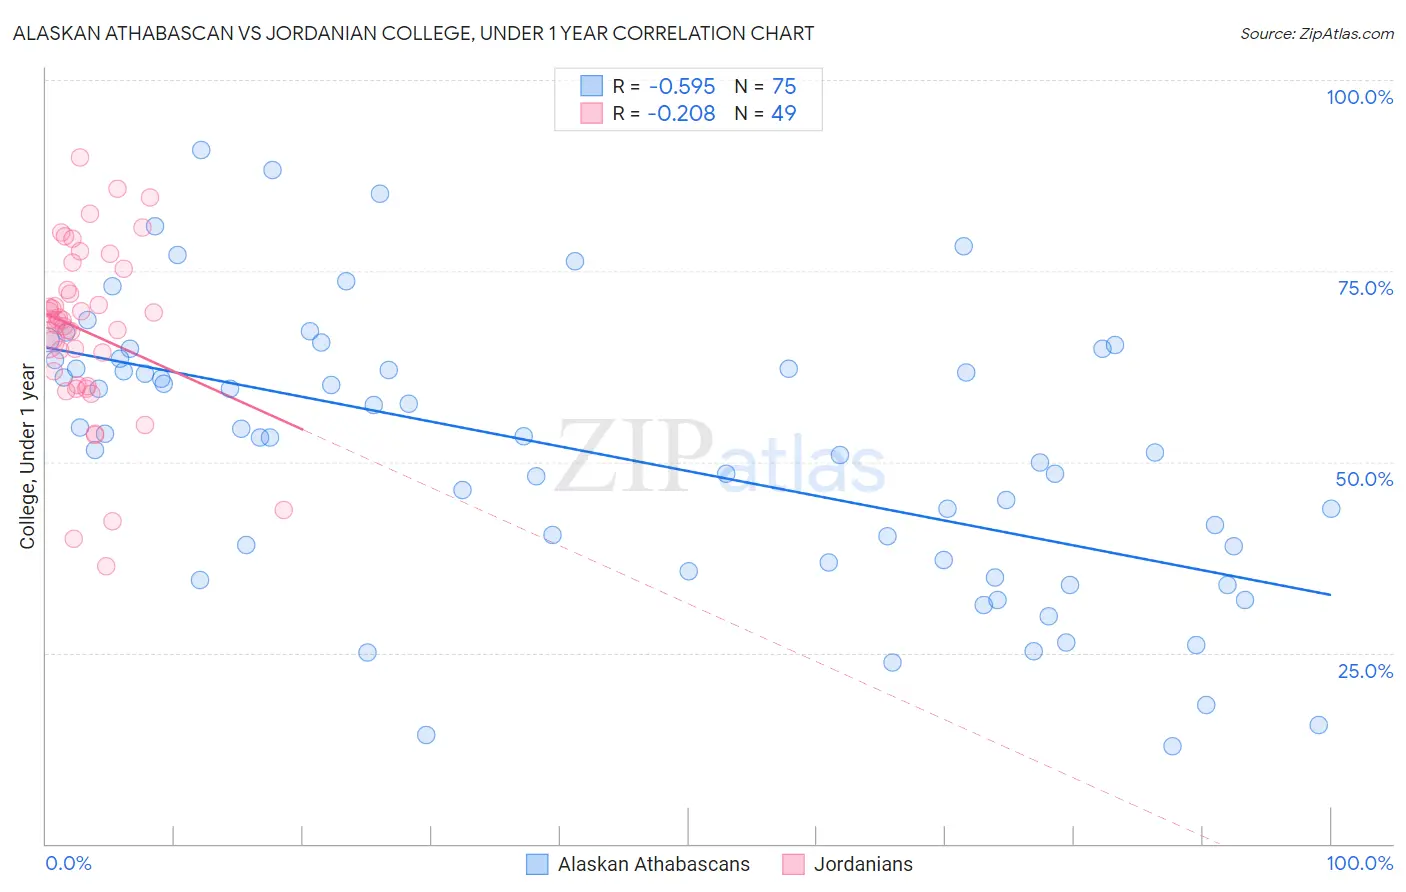
Alaskan Athabascan vs Jordanian College, Under 1 year Correlation Chart
The statistical analysis conducted on geographies consisting of 45,820,412 people shows a substantial negative correlation between the proportion of Alaskan Athabascans and percentage of population with at least college, under 1 year education in the United States with a correlation coefficient (R) of -0.595 and weighted average of 61.0%. Similarly, the statistical analysis conducted on geographies consisting of 166,424,117 people shows a weak negative correlation between the proportion of Jordanians and percentage of population with at least college, under 1 year education in the United States with a correlation coefficient (R) of -0.208 and weighted average of 68.0%, a difference of 11.5%.
College, Under 1 year Correlation Summary
| Measurement | Alaskan Athabascan | Jordanian |
| Minimum | 12.7% | 36.4% |
| Maximum | 90.8% | 89.8% |
| Range | 78.1% | 53.4% |
| Mean | 51.2% | 67.0% |
| Median | 53.2% | 68.5% |
| Interquartile 25% (IQ1) | 36.8% | 60.0% |
| Interquartile 75% (IQ3) | 63.4% | 74.0% |
| Interquartile Range (IQR) | 26.5% | 14.0% |
| Standard Deviation (Sample) | 18.1% | 11.5% |
| Standard Deviation (Population) | 18.0% | 11.3% |
Similar Demographics by College, Under 1 year
Demographics Similar to Alaskan Athabascans by College, Under 1 year
In terms of college, under 1 year, the demographic groups most similar to Alaskan Athabascans are American (61.0%, a difference of 0.010%), Trinidadian and Tobagonian (61.1%, a difference of 0.12%), Immigrants from Bahamas (61.1%, a difference of 0.12%), Barbadian (61.1%, a difference of 0.18%), and Shoshone (61.1%, a difference of 0.18%).
| Demographics | Rating | Rank | College, Under 1 year |
| Indonesians | 0.3 /100 | #259 | Tragic 61.2% |
| Blackfeet | 0.3 /100 | #260 | Tragic 61.1% |
| Africans | 0.3 /100 | #261 | Tragic 61.1% |
| Barbadians | 0.2 /100 | #262 | Tragic 61.1% |
| Shoshone | 0.2 /100 | #263 | Tragic 61.1% |
| Trinidadians and Tobagonians | 0.2 /100 | #264 | Tragic 61.1% |
| Immigrants | Bahamas | 0.2 /100 | #265 | Tragic 61.1% |
| Alaskan Athabascans | 0.2 /100 | #266 | Tragic 61.0% |
| Americans | 0.2 /100 | #267 | Tragic 61.0% |
| Immigrants | Trinidad and Tobago | 0.1 /100 | #268 | Tragic 60.7% |
| Immigrants | West Indies | 0.1 /100 | #269 | Tragic 60.6% |
| Cheyenne | 0.1 /100 | #270 | Tragic 60.6% |
| U.S. Virgin Islanders | 0.1 /100 | #271 | Tragic 60.6% |
| Jamaicans | 0.1 /100 | #272 | Tragic 60.5% |
| Chickasaw | 0.1 /100 | #273 | Tragic 60.4% |
Demographics Similar to Jordanians by College, Under 1 year
In terms of college, under 1 year, the demographic groups most similar to Jordanians are Immigrants from Pakistan (68.0%, a difference of 0.030%), Immigrants from Ethiopia (68.0%, a difference of 0.030%), Armenian (68.1%, a difference of 0.13%), Paraguayan (67.9%, a difference of 0.13%), and Immigrants from Bolivia (67.9%, a difference of 0.15%).
| Demographics | Rating | Rank | College, Under 1 year |
| Ethiopians | 98.2 /100 | #89 | Exceptional 68.3% |
| Icelanders | 98.1 /100 | #90 | Exceptional 68.3% |
| Europeans | 98.1 /100 | #91 | Exceptional 68.2% |
| Luxembourgers | 98.1 /100 | #92 | Exceptional 68.2% |
| Romanians | 97.9 /100 | #93 | Exceptional 68.2% |
| Armenians | 97.7 /100 | #94 | Exceptional 68.1% |
| Immigrants | Pakistan | 97.5 /100 | #95 | Exceptional 68.0% |
| Jordanians | 97.4 /100 | #96 | Exceptional 68.0% |
| Immigrants | Ethiopia | 97.3 /100 | #97 | Exceptional 68.0% |
| Paraguayans | 97.1 /100 | #98 | Exceptional 67.9% |
| Immigrants | Bolivia | 97.0 /100 | #99 | Exceptional 67.9% |
| Immigrants | Argentina | 97.0 /100 | #100 | Exceptional 67.9% |
| Immigrants | Eastern Europe | 96.9 /100 | #101 | Exceptional 67.9% |
| Palestinians | 96.9 /100 | #102 | Exceptional 67.9% |
| Carpatho Rusyns | 96.8 /100 | #103 | Exceptional 67.9% |