Alaskan Athabascan vs Immigrants from Bulgaria College, Under 1 year
COMPARE
Alaskan Athabascan
Immigrants from Bulgaria
College, Under 1 year
College, Under 1 year Comparison
Alaskan Athabascans
Immigrants from Bulgaria
61.0%
COLLEGE, UNDER 1 YEAR
0.2/ 100
METRIC RATING
266th/ 347
METRIC RANK
70.0%
COLLEGE, UNDER 1 YEAR
99.8/ 100
METRIC RATING
47th/ 347
METRIC RANK
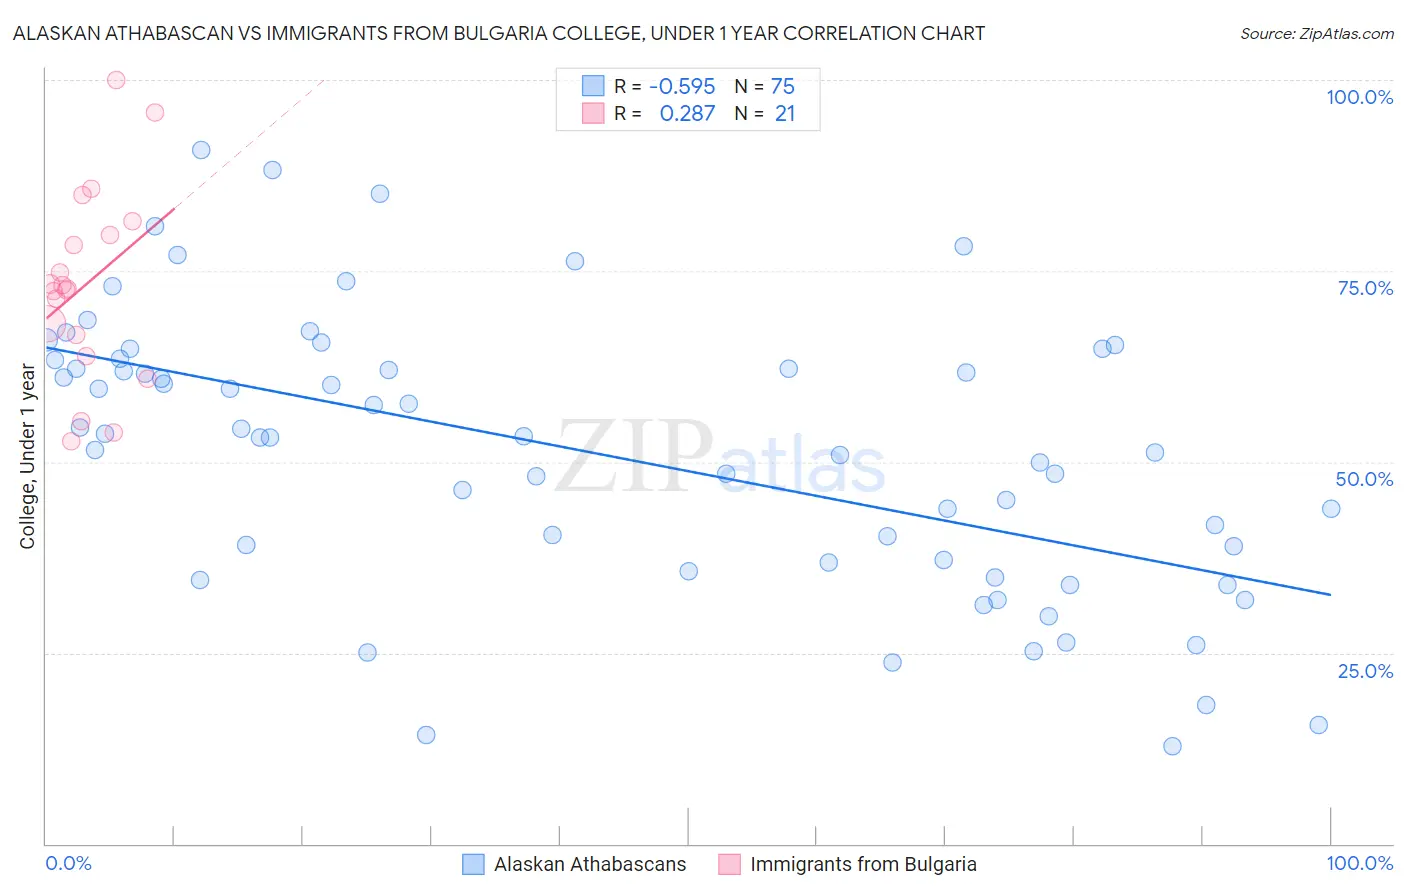
Alaskan Athabascan vs Immigrants from Bulgaria College, Under 1 year Correlation Chart
The statistical analysis conducted on geographies consisting of 45,820,412 people shows a substantial negative correlation between the proportion of Alaskan Athabascans and percentage of population with at least college, under 1 year education in the United States with a correlation coefficient (R) of -0.595 and weighted average of 61.0%. Similarly, the statistical analysis conducted on geographies consisting of 172,550,092 people shows a weak positive correlation between the proportion of Immigrants from Bulgaria and percentage of population with at least college, under 1 year education in the United States with a correlation coefficient (R) of 0.287 and weighted average of 70.0%, a difference of 14.8%.
College, Under 1 year Correlation Summary
| Measurement | Alaskan Athabascan | Immigrants from Bulgaria |
| Minimum | 12.7% | 52.7% |
| Maximum | 90.8% | 100.0% |
| Range | 78.1% | 47.3% |
| Mean | 51.2% | 73.2% |
| Median | 53.2% | 72.6% |
| Interquartile 25% (IQ1) | 36.8% | 65.2% |
| Interquartile 75% (IQ3) | 63.4% | 80.6% |
| Interquartile Range (IQR) | 26.5% | 15.4% |
| Standard Deviation (Sample) | 18.1% | 12.4% |
| Standard Deviation (Population) | 18.0% | 12.1% |
Similar Demographics by College, Under 1 year
Demographics Similar to Alaskan Athabascans by College, Under 1 year
In terms of college, under 1 year, the demographic groups most similar to Alaskan Athabascans are American (61.0%, a difference of 0.010%), Trinidadian and Tobagonian (61.1%, a difference of 0.12%), Immigrants from Bahamas (61.1%, a difference of 0.12%), Barbadian (61.1%, a difference of 0.18%), and Shoshone (61.1%, a difference of 0.18%).
| Demographics | Rating | Rank | College, Under 1 year |
| Indonesians | 0.3 /100 | #259 | Tragic 61.2% |
| Blackfeet | 0.3 /100 | #260 | Tragic 61.1% |
| Africans | 0.3 /100 | #261 | Tragic 61.1% |
| Barbadians | 0.2 /100 | #262 | Tragic 61.1% |
| Shoshone | 0.2 /100 | #263 | Tragic 61.1% |
| Trinidadians and Tobagonians | 0.2 /100 | #264 | Tragic 61.1% |
| Immigrants | Bahamas | 0.2 /100 | #265 | Tragic 61.1% |
| Alaskan Athabascans | 0.2 /100 | #266 | Tragic 61.0% |
| Americans | 0.2 /100 | #267 | Tragic 61.0% |
| Immigrants | Trinidad and Tobago | 0.1 /100 | #268 | Tragic 60.7% |
| Immigrants | West Indies | 0.1 /100 | #269 | Tragic 60.6% |
| Cheyenne | 0.1 /100 | #270 | Tragic 60.6% |
| U.S. Virgin Islanders | 0.1 /100 | #271 | Tragic 60.6% |
| Jamaicans | 0.1 /100 | #272 | Tragic 60.5% |
| Chickasaw | 0.1 /100 | #273 | Tragic 60.4% |
Demographics Similar to Immigrants from Bulgaria by College, Under 1 year
In terms of college, under 1 year, the demographic groups most similar to Immigrants from Bulgaria are Immigrants from Netherlands (70.0%, a difference of 0.060%), Immigrants from Austria (70.0%, a difference of 0.10%), Immigrants from Latvia (70.1%, a difference of 0.11%), Zimbabwean (69.9%, a difference of 0.22%), and Immigrants from Norway (70.2%, a difference of 0.23%).
| Demographics | Rating | Rank | College, Under 1 year |
| Immigrants | Turkey | 99.9 /100 | #40 | Exceptional 70.3% |
| Immigrants | Kuwait | 99.9 /100 | #41 | Exceptional 70.3% |
| Immigrants | Lithuania | 99.9 /100 | #42 | Exceptional 70.3% |
| Israelis | 99.9 /100 | #43 | Exceptional 70.2% |
| New Zealanders | 99.9 /100 | #44 | Exceptional 70.2% |
| Immigrants | Norway | 99.9 /100 | #45 | Exceptional 70.2% |
| Immigrants | Latvia | 99.9 /100 | #46 | Exceptional 70.1% |
| Immigrants | Bulgaria | 99.8 /100 | #47 | Exceptional 70.0% |
| Immigrants | Netherlands | 99.8 /100 | #48 | Exceptional 70.0% |
| Immigrants | Austria | 99.8 /100 | #49 | Exceptional 70.0% |
| Zimbabweans | 99.8 /100 | #50 | Exceptional 69.9% |
| Mongolians | 99.8 /100 | #51 | Exceptional 69.9% |
| Immigrants | Russia | 99.8 /100 | #52 | Exceptional 69.9% |
| South Africans | 99.7 /100 | #53 | Exceptional 69.7% |
| Immigrants | Czechoslovakia | 99.7 /100 | #54 | Exceptional 69.6% |