Immigrants from Spain vs Immigrants from Uganda College, Under 1 year
COMPARE
Immigrants from Spain
Immigrants from Uganda
College, Under 1 year
College, Under 1 year Comparison
Immigrants from Spain
Immigrants from Uganda
68.4%
COLLEGE, UNDER 1 YEAR
98.5/ 100
METRIC RATING
80th/ 347
METRIC RANK
66.5%
COLLEGE, UNDER 1 YEAR
82.8/ 100
METRIC RATING
143rd/ 347
METRIC RANK
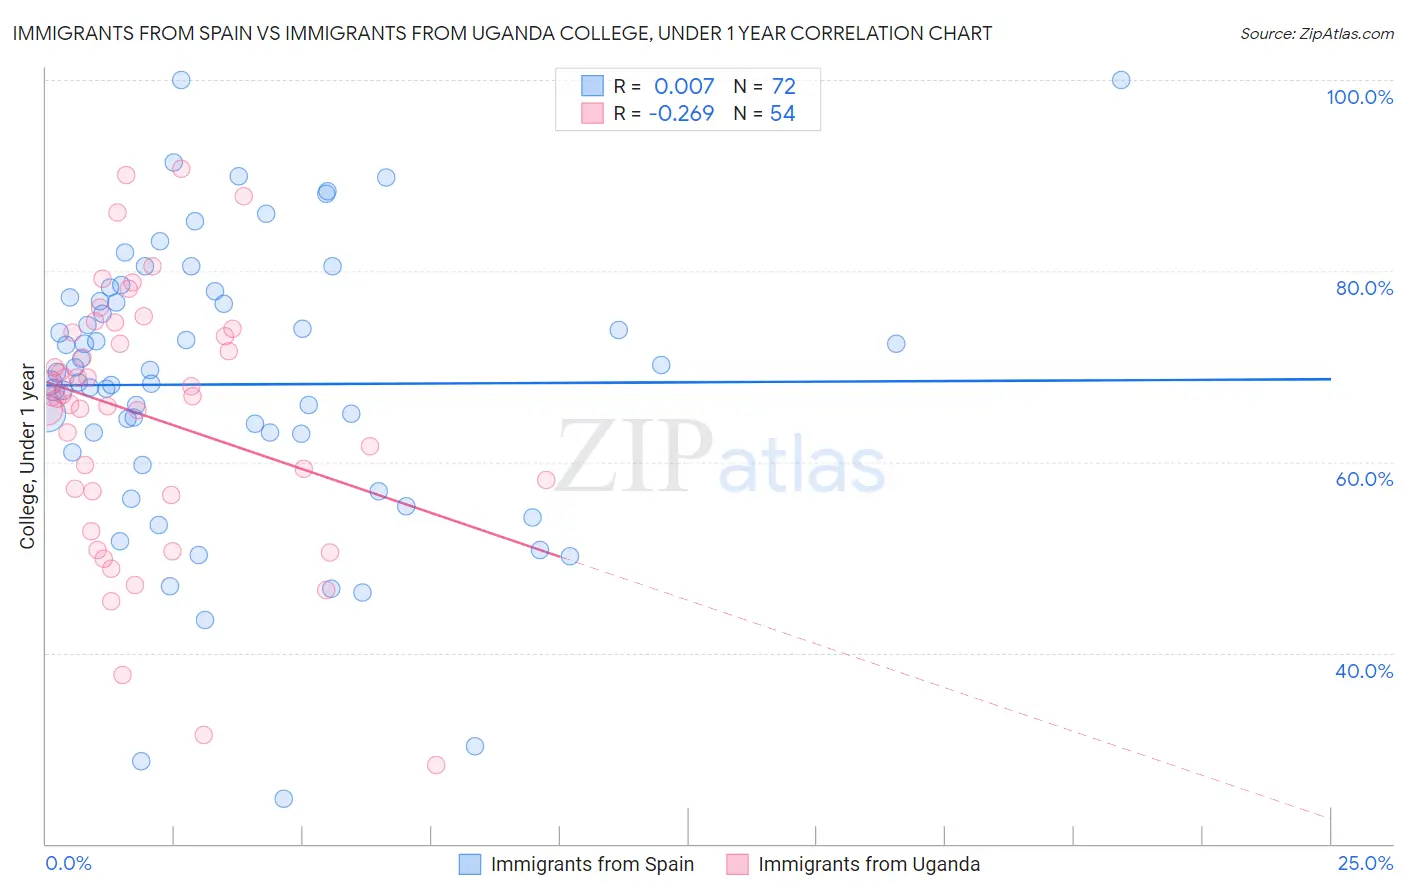
Immigrants from Spain vs Immigrants from Uganda College, Under 1 year Correlation Chart
The statistical analysis conducted on geographies consisting of 239,683,397 people shows no correlation between the proportion of Immigrants from Spain and percentage of population with at least college, under 1 year education in the United States with a correlation coefficient (R) of 0.007 and weighted average of 68.4%. Similarly, the statistical analysis conducted on geographies consisting of 125,982,535 people shows a weak negative correlation between the proportion of Immigrants from Uganda and percentage of population with at least college, under 1 year education in the United States with a correlation coefficient (R) of -0.269 and weighted average of 66.5%, a difference of 2.9%.
College, Under 1 year Correlation Summary
| Measurement | Immigrants from Spain | Immigrants from Uganda |
| Minimum | 24.8% | 28.3% |
| Maximum | 100.0% | 90.7% |
| Range | 75.2% | 62.4% |
| Mean | 68.1% | 64.8% |
| Median | 68.9% | 66.8% |
| Interquartile 25% (IQ1) | 62.0% | 57.0% |
| Interquartile 75% (IQ3) | 77.0% | 73.5% |
| Interquartile Range (IQR) | 15.0% | 16.6% |
| Standard Deviation (Sample) | 15.0% | 13.6% |
| Standard Deviation (Population) | 14.9% | 13.5% |
Similar Demographics by College, Under 1 year
Demographics Similar to Immigrants from Spain by College, Under 1 year
In terms of college, under 1 year, the demographic groups most similar to Immigrants from Spain are Greek (68.5%, a difference of 0.030%), Danish (68.5%, a difference of 0.040%), Immigrants from Greece (68.4%, a difference of 0.040%), British (68.5%, a difference of 0.050%), and Immigrants from Western Europe (68.5%, a difference of 0.090%).
| Demographics | Rating | Rank | College, Under 1 year |
| Immigrants | England | 99.0 /100 | #73 | Exceptional 68.7% |
| Swedes | 98.9 /100 | #74 | Exceptional 68.7% |
| Immigrants | Western Europe | 98.6 /100 | #75 | Exceptional 68.5% |
| Laotians | 98.6 /100 | #76 | Exceptional 68.5% |
| British | 98.6 /100 | #77 | Exceptional 68.5% |
| Danes | 98.6 /100 | #78 | Exceptional 68.5% |
| Greeks | 98.6 /100 | #79 | Exceptional 68.5% |
| Immigrants | Spain | 98.5 /100 | #80 | Exceptional 68.4% |
| Immigrants | Greece | 98.5 /100 | #81 | Exceptional 68.4% |
| Norwegians | 98.4 /100 | #82 | Exceptional 68.4% |
| Argentineans | 98.4 /100 | #83 | Exceptional 68.4% |
| Immigrants | Hungary | 98.3 /100 | #84 | Exceptional 68.3% |
| Egyptians | 98.3 /100 | #85 | Exceptional 68.3% |
| Immigrants | Lebanon | 98.3 /100 | #86 | Exceptional 68.3% |
| Chinese | 98.3 /100 | #87 | Exceptional 68.3% |
Demographics Similar to Immigrants from Uganda by College, Under 1 year
In terms of college, under 1 year, the demographic groups most similar to Immigrants from Uganda are English (66.6%, a difference of 0.010%), Immigrants from Germany (66.5%, a difference of 0.060%), Immigrants from Kenya (66.5%, a difference of 0.070%), Kenyan (66.5%, a difference of 0.080%), and Immigrants from Morocco (66.5%, a difference of 0.080%).
| Demographics | Rating | Rank | College, Under 1 year |
| Ugandans | 87.8 /100 | #136 | Excellent 66.8% |
| Immigrants | Chile | 87.4 /100 | #137 | Excellent 66.8% |
| Immigrants | Italy | 86.9 /100 | #138 | Excellent 66.8% |
| Venezuelans | 85.9 /100 | #139 | Excellent 66.7% |
| Slavs | 85.9 /100 | #140 | Excellent 66.7% |
| Immigrants | Afghanistan | 85.1 /100 | #141 | Excellent 66.7% |
| English | 82.9 /100 | #142 | Excellent 66.6% |
| Immigrants | Uganda | 82.8 /100 | #143 | Excellent 66.5% |
| Immigrants | Germany | 82.0 /100 | #144 | Excellent 66.5% |
| Immigrants | Kenya | 81.8 /100 | #145 | Excellent 66.5% |
| Kenyans | 81.7 /100 | #146 | Excellent 66.5% |
| Immigrants | Morocco | 81.7 /100 | #147 | Excellent 66.5% |
| Taiwanese | 78.6 /100 | #148 | Good 66.4% |
| Immigrants | Venezuela | 77.9 /100 | #149 | Good 66.3% |
| Immigrants | Iraq | 77.1 /100 | #150 | Good 66.3% |