Alaskan Athabascan vs Immigrants from Philippines College, Under 1 year
COMPARE
Alaskan Athabascan
Immigrants from Philippines
College, Under 1 year
College, Under 1 year Comparison
Alaskan Athabascans
Immigrants from Philippines
61.0%
COLLEGE, UNDER 1 YEAR
0.2/ 100
METRIC RATING
266th/ 347
METRIC RANK
64.8%
COLLEGE, UNDER 1 YEAR
30.1/ 100
METRIC RATING
190th/ 347
METRIC RANK
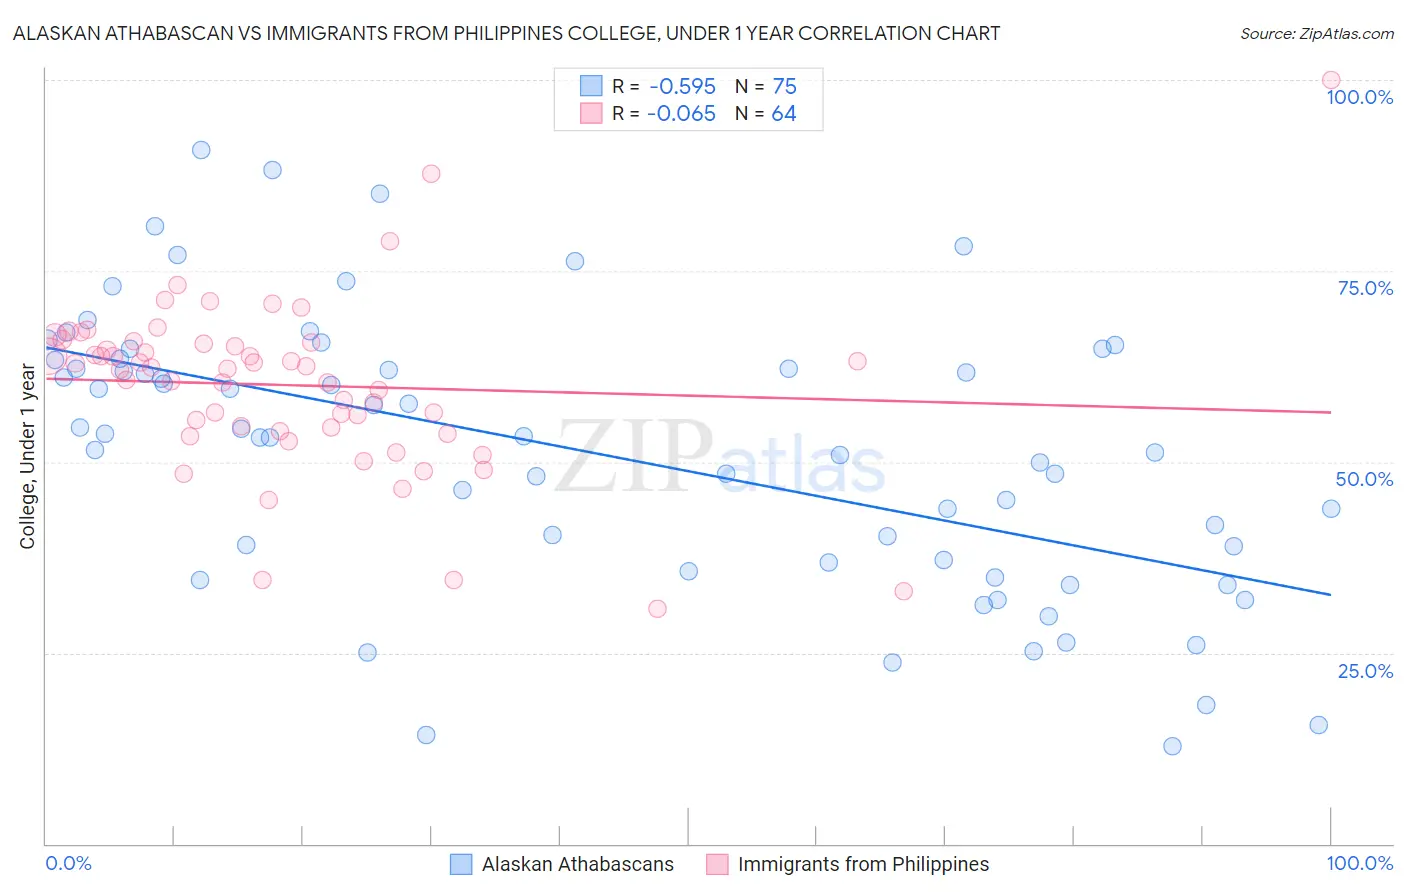
Alaskan Athabascan vs Immigrants from Philippines College, Under 1 year Correlation Chart
The statistical analysis conducted on geographies consisting of 45,820,412 people shows a substantial negative correlation between the proportion of Alaskan Athabascans and percentage of population with at least college, under 1 year education in the United States with a correlation coefficient (R) of -0.595 and weighted average of 61.0%. Similarly, the statistical analysis conducted on geographies consisting of 471,303,871 people shows a slight negative correlation between the proportion of Immigrants from Philippines and percentage of population with at least college, under 1 year education in the United States with a correlation coefficient (R) of -0.065 and weighted average of 64.8%, a difference of 6.3%.
College, Under 1 year Correlation Summary
| Measurement | Alaskan Athabascan | Immigrants from Philippines |
| Minimum | 12.7% | 30.7% |
| Maximum | 90.8% | 100.0% |
| Range | 78.1% | 69.3% |
| Mean | 51.2% | 60.1% |
| Median | 53.2% | 62.3% |
| Interquartile 25% (IQ1) | 36.8% | 54.2% |
| Interquartile 75% (IQ3) | 63.4% | 65.6% |
| Interquartile Range (IQR) | 26.5% | 11.3% |
| Standard Deviation (Sample) | 18.1% | 11.4% |
| Standard Deviation (Population) | 18.0% | 11.3% |
Similar Demographics by College, Under 1 year
Demographics Similar to Alaskan Athabascans by College, Under 1 year
In terms of college, under 1 year, the demographic groups most similar to Alaskan Athabascans are American (61.0%, a difference of 0.010%), Trinidadian and Tobagonian (61.1%, a difference of 0.12%), Immigrants from Bahamas (61.1%, a difference of 0.12%), Barbadian (61.1%, a difference of 0.18%), and Shoshone (61.1%, a difference of 0.18%).
| Demographics | Rating | Rank | College, Under 1 year |
| Indonesians | 0.3 /100 | #259 | Tragic 61.2% |
| Blackfeet | 0.3 /100 | #260 | Tragic 61.1% |
| Africans | 0.3 /100 | #261 | Tragic 61.1% |
| Barbadians | 0.2 /100 | #262 | Tragic 61.1% |
| Shoshone | 0.2 /100 | #263 | Tragic 61.1% |
| Trinidadians and Tobagonians | 0.2 /100 | #264 | Tragic 61.1% |
| Immigrants | Bahamas | 0.2 /100 | #265 | Tragic 61.1% |
| Alaskan Athabascans | 0.2 /100 | #266 | Tragic 61.0% |
| Americans | 0.2 /100 | #267 | Tragic 61.0% |
| Immigrants | Trinidad and Tobago | 0.1 /100 | #268 | Tragic 60.7% |
| Immigrants | West Indies | 0.1 /100 | #269 | Tragic 60.6% |
| Cheyenne | 0.1 /100 | #270 | Tragic 60.6% |
| U.S. Virgin Islanders | 0.1 /100 | #271 | Tragic 60.6% |
| Jamaicans | 0.1 /100 | #272 | Tragic 60.5% |
| Chickasaw | 0.1 /100 | #273 | Tragic 60.4% |
Demographics Similar to Immigrants from Philippines by College, Under 1 year
In terms of college, under 1 year, the demographic groups most similar to Immigrants from Philippines are Spanish (64.9%, a difference of 0.080%), Immigrants from Albania (64.9%, a difference of 0.10%), Immigrants from Armenia (64.7%, a difference of 0.11%), Immigrants from Thailand (64.7%, a difference of 0.17%), and Slovak (64.7%, a difference of 0.19%).
| Demographics | Rating | Rank | College, Under 1 year |
| Immigrants | Poland | 42.6 /100 | #183 | Average 65.2% |
| Bermudans | 42.0 /100 | #184 | Average 65.2% |
| Sri Lankans | 41.7 /100 | #185 | Average 65.2% |
| Immigrants | Sierra Leone | 39.7 /100 | #186 | Fair 65.1% |
| Immigrants | Southern Europe | 34.3 /100 | #187 | Fair 64.9% |
| Immigrants | Albania | 32.0 /100 | #188 | Fair 64.9% |
| Spanish | 31.6 /100 | #189 | Fair 64.9% |
| Immigrants | Philippines | 30.1 /100 | #190 | Fair 64.8% |
| Immigrants | Armenia | 28.1 /100 | #191 | Fair 64.7% |
| Immigrants | Thailand | 27.0 /100 | #192 | Fair 64.7% |
| Slovaks | 26.7 /100 | #193 | Fair 64.7% |
| Immigrants | Cameroon | 24.6 /100 | #194 | Fair 64.6% |
| Immigrants | South Eastern Asia | 22.1 /100 | #195 | Fair 64.5% |
| Tongans | 21.2 /100 | #196 | Fair 64.5% |
| Costa Ricans | 19.6 /100 | #197 | Poor 64.4% |