Alaska Native vs Guamanian/Chamorro GED/Equivalency
COMPARE
Alaska Native
Guamanian/Chamorro
GED/Equivalency
GED/Equivalency Comparison
Alaska Natives
Guamanians/Chamorros
84.7%
GED/EQUIVALENCY
8.6/ 100
METRIC RATING
218th/ 347
METRIC RANK
85.3%
GED/EQUIVALENCY
28.4/ 100
METRIC RATING
189th/ 347
METRIC RANK
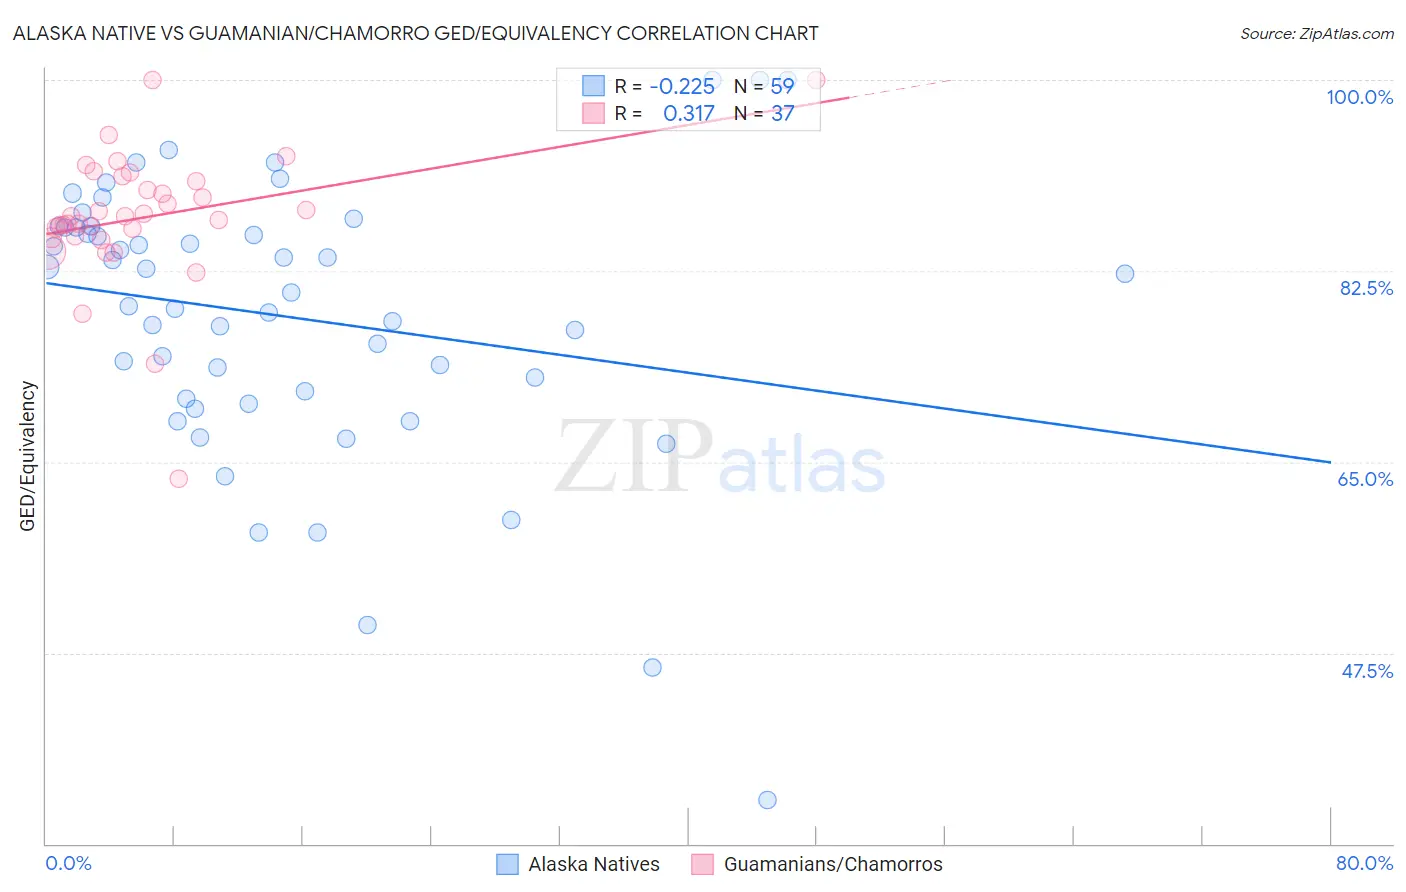
Alaska Native vs Guamanian/Chamorro GED/Equivalency Correlation Chart
The statistical analysis conducted on geographies consisting of 76,778,887 people shows a weak negative correlation between the proportion of Alaska Natives and percentage of population with at least ged/equivalency education in the United States with a correlation coefficient (R) of -0.225 and weighted average of 84.7%. Similarly, the statistical analysis conducted on geographies consisting of 221,965,618 people shows a mild positive correlation between the proportion of Guamanians/Chamorros and percentage of population with at least ged/equivalency education in the United States with a correlation coefficient (R) of 0.317 and weighted average of 85.3%, a difference of 0.75%.
GED/Equivalency Correlation Summary
| Measurement | Alaska Native | Guamanian/Chamorro |
| Minimum | 34.0% | 63.5% |
| Maximum | 100.0% | 100.0% |
| Range | 66.0% | 36.5% |
| Mean | 78.3% | 87.4% |
| Median | 80.5% | 87.5% |
| Interquartile 25% (IQ1) | 70.8% | 85.6% |
| Interquartile 75% (IQ3) | 86.5% | 90.9% |
| Interquartile Range (IQR) | 15.7% | 5.3% |
| Standard Deviation (Sample) | 12.9% | 6.3% |
| Standard Deviation (Population) | 12.7% | 6.2% |
Similar Demographics by GED/Equivalency
Demographics Similar to Alaska Natives by GED/Equivalency
In terms of ged/equivalency, the demographic groups most similar to Alaska Natives are Immigrants from Micronesia (84.7%, a difference of 0.0%), Nigerian (84.7%, a difference of 0.0%), Peruvian (84.7%, a difference of 0.030%), Potawatomi (84.7%, a difference of 0.030%), and American (84.7%, a difference of 0.030%).
| Demographics | Rating | Rank | GED/Equivalency |
| South Americans | 10.9 /100 | #211 | Poor 84.8% |
| Immigrants | Somalia | 10.6 /100 | #212 | Poor 84.8% |
| Immigrants | Philippines | 10.0 /100 | #213 | Poor 84.8% |
| Osage | 9.5 /100 | #214 | Tragic 84.8% |
| Peruvians | 9.2 /100 | #215 | Tragic 84.7% |
| Immigrants | Micronesia | 8.7 /100 | #216 | Tragic 84.7% |
| Nigerians | 8.6 /100 | #217 | Tragic 84.7% |
| Alaska Natives | 8.6 /100 | #218 | Tragic 84.7% |
| Potawatomi | 8.2 /100 | #219 | Tragic 84.7% |
| Americans | 8.2 /100 | #220 | Tragic 84.7% |
| Taiwanese | 8.1 /100 | #221 | Tragic 84.7% |
| Iroquois | 7.5 /100 | #222 | Tragic 84.6% |
| Immigrants | Uzbekistan | 7.1 /100 | #223 | Tragic 84.6% |
| French American Indians | 6.3 /100 | #224 | Tragic 84.6% |
| Immigrants | Thailand | 5.8 /100 | #225 | Tragic 84.5% |
Demographics Similar to Guamanians/Chamorros by GED/Equivalency
In terms of ged/equivalency, the demographic groups most similar to Guamanians/Chamorros are Immigrants from Sierra Leone (85.4%, a difference of 0.010%), Alaskan Athabascan (85.3%, a difference of 0.020%), Immigrants from Afghanistan (85.4%, a difference of 0.030%), Spaniard (85.4%, a difference of 0.090%), and Spanish (85.4%, a difference of 0.11%).
| Demographics | Rating | Rank | GED/Equivalency |
| Sudanese | 35.2 /100 | #182 | Fair 85.5% |
| Immigrants | Sudan | 34.2 /100 | #183 | Fair 85.5% |
| Immigrants | Oceania | 33.6 /100 | #184 | Fair 85.5% |
| Spanish | 32.8 /100 | #185 | Fair 85.4% |
| Spaniards | 31.9 /100 | #186 | Fair 85.4% |
| Immigrants | Afghanistan | 29.8 /100 | #187 | Fair 85.4% |
| Immigrants | Sierra Leone | 29.0 /100 | #188 | Fair 85.4% |
| Guamanians/Chamorros | 28.4 /100 | #189 | Fair 85.3% |
| Alaskan Athabascans | 27.5 /100 | #190 | Fair 85.3% |
| South American Indians | 22.8 /100 | #191 | Fair 85.2% |
| Immigrants | Nonimmigrants | 22.7 /100 | #192 | Fair 85.2% |
| Delaware | 22.2 /100 | #193 | Fair 85.2% |
| Puget Sound Salish | 20.8 /100 | #194 | Fair 85.2% |
| Chippewa | 20.8 /100 | #195 | Fair 85.2% |
| Tongans | 20.7 /100 | #196 | Fair 85.2% |