Alaska Native vs Immigrants from Peru GED/Equivalency
COMPARE
Alaska Native
Immigrants from Peru
GED/Equivalency
GED/Equivalency Comparison
Alaska Natives
Immigrants from Peru
84.7%
GED/EQUIVALENCY
8.6/ 100
METRIC RATING
218th/ 347
METRIC RANK
84.2%
GED/EQUIVALENCY
2.7/ 100
METRIC RATING
238th/ 347
METRIC RANK
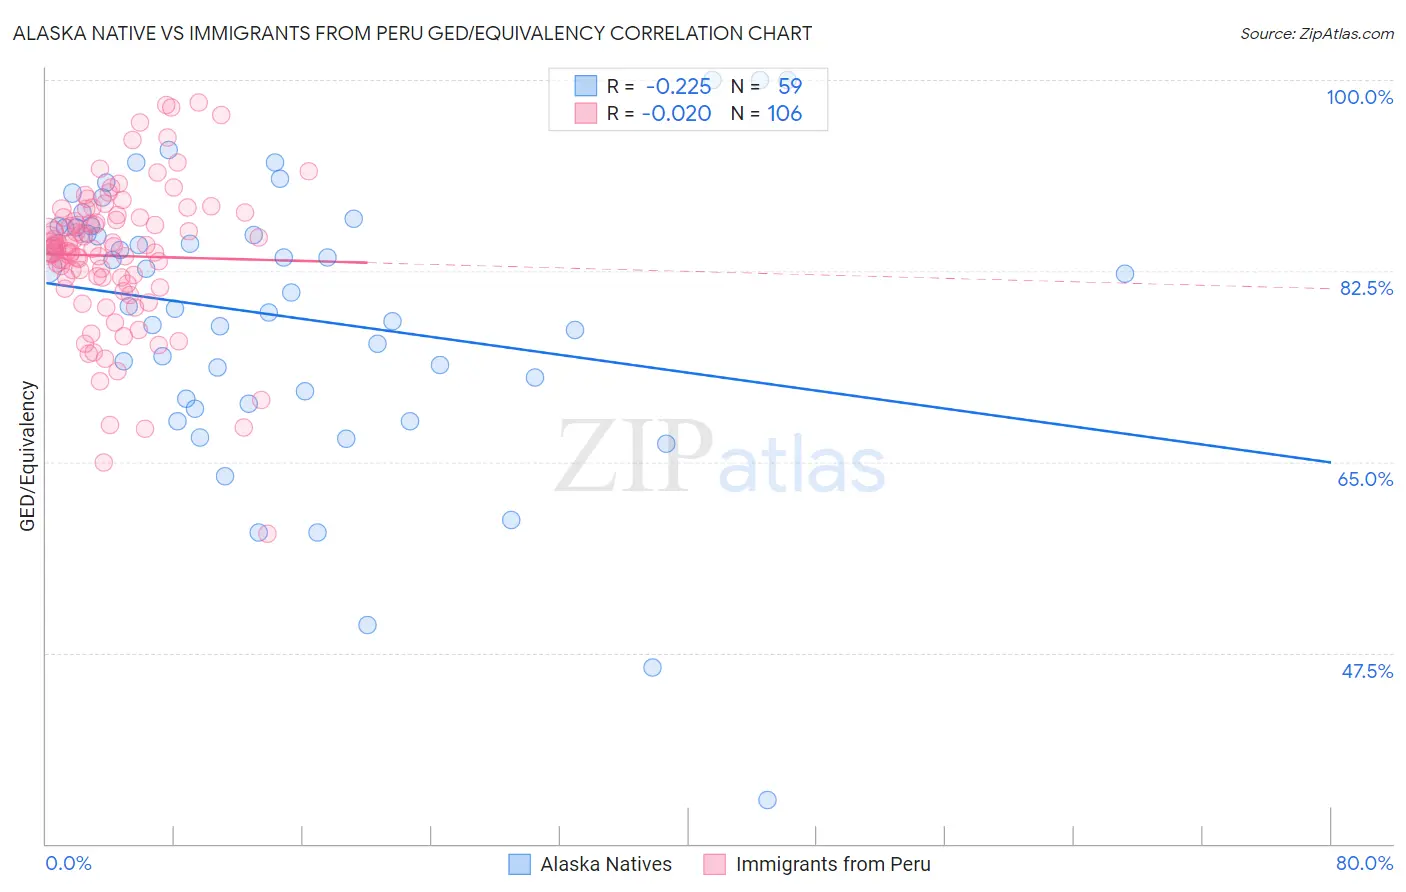
Alaska Native vs Immigrants from Peru GED/Equivalency Correlation Chart
The statistical analysis conducted on geographies consisting of 76,778,887 people shows a weak negative correlation between the proportion of Alaska Natives and percentage of population with at least ged/equivalency education in the United States with a correlation coefficient (R) of -0.225 and weighted average of 84.7%. Similarly, the statistical analysis conducted on geographies consisting of 328,860,880 people shows no correlation between the proportion of Immigrants from Peru and percentage of population with at least ged/equivalency education in the United States with a correlation coefficient (R) of -0.020 and weighted average of 84.2%, a difference of 0.64%.
GED/Equivalency Correlation Summary
| Measurement | Alaska Native | Immigrants from Peru |
| Minimum | 34.0% | 58.5% |
| Maximum | 100.0% | 97.9% |
| Range | 66.0% | 39.5% |
| Mean | 78.3% | 83.9% |
| Median | 80.5% | 84.6% |
| Interquartile 25% (IQ1) | 70.8% | 81.3% |
| Interquartile 75% (IQ3) | 86.5% | 87.4% |
| Interquartile Range (IQR) | 15.7% | 6.1% |
| Standard Deviation (Sample) | 12.9% | 6.8% |
| Standard Deviation (Population) | 12.7% | 6.8% |
Demographics Similar to Alaska Natives and Immigrants from Peru by GED/Equivalency
In terms of ged/equivalency, the demographic groups most similar to Alaska Natives are Potawatomi (84.7%, a difference of 0.030%), American (84.7%, a difference of 0.030%), Taiwanese (84.7%, a difference of 0.040%), Iroquois (84.6%, a difference of 0.080%), and Immigrants from Uzbekistan (84.6%, a difference of 0.11%). Similarly, the demographic groups most similar to Immigrants from Peru are Subsaharan African (84.2%, a difference of 0.060%), Ghanaian (84.3%, a difference of 0.13%), Immigrants from Eritrea (84.3%, a difference of 0.13%), Immigrants from Nigeria (84.3%, a difference of 0.16%), and Immigrants from Panama (84.4%, a difference of 0.23%).
| Demographics | Rating | Rank | GED/Equivalency |
| Alaska Natives | 8.6 /100 | #218 | Tragic 84.7% |
| Potawatomi | 8.2 /100 | #219 | Tragic 84.7% |
| Americans | 8.2 /100 | #220 | Tragic 84.7% |
| Taiwanese | 8.1 /100 | #221 | Tragic 84.7% |
| Iroquois | 7.5 /100 | #222 | Tragic 84.6% |
| Immigrants | Uzbekistan | 7.1 /100 | #223 | Tragic 84.6% |
| French American Indians | 6.3 /100 | #224 | Tragic 84.6% |
| Immigrants | Thailand | 5.8 /100 | #225 | Tragic 84.5% |
| Immigrants | Zaire | 5.5 /100 | #226 | Tragic 84.5% |
| Immigrants | Costa Rica | 5.4 /100 | #227 | Tragic 84.5% |
| Immigrants | Liberia | 4.9 /100 | #228 | Tragic 84.4% |
| Immigrants | Uruguay | 4.6 /100 | #229 | Tragic 84.4% |
| Immigrants | Colombia | 4.5 /100 | #230 | Tragic 84.4% |
| Immigrants | Middle Africa | 4.3 /100 | #231 | Tragic 84.4% |
| Immigrants | South America | 4.2 /100 | #232 | Tragic 84.4% |
| Immigrants | Panama | 4.1 /100 | #233 | Tragic 84.4% |
| Immigrants | Nigeria | 3.6 /100 | #234 | Tragic 84.3% |
| Ghanaians | 3.5 /100 | #235 | Tragic 84.3% |
| Immigrants | Eritrea | 3.5 /100 | #236 | Tragic 84.3% |
| Sub-Saharan Africans | 3.0 /100 | #237 | Tragic 84.2% |
| Immigrants | Peru | 2.7 /100 | #238 | Tragic 84.2% |