Australian vs Guamanian/Chamorro GED/Equivalency
COMPARE
Australian
Guamanian/Chamorro
GED/Equivalency
GED/Equivalency Comparison
Australians
Guamanians/Chamorros
88.1%
GED/EQUIVALENCY
99.5/ 100
METRIC RATING
49th/ 347
METRIC RANK
85.3%
GED/EQUIVALENCY
28.4/ 100
METRIC RATING
189th/ 347
METRIC RANK
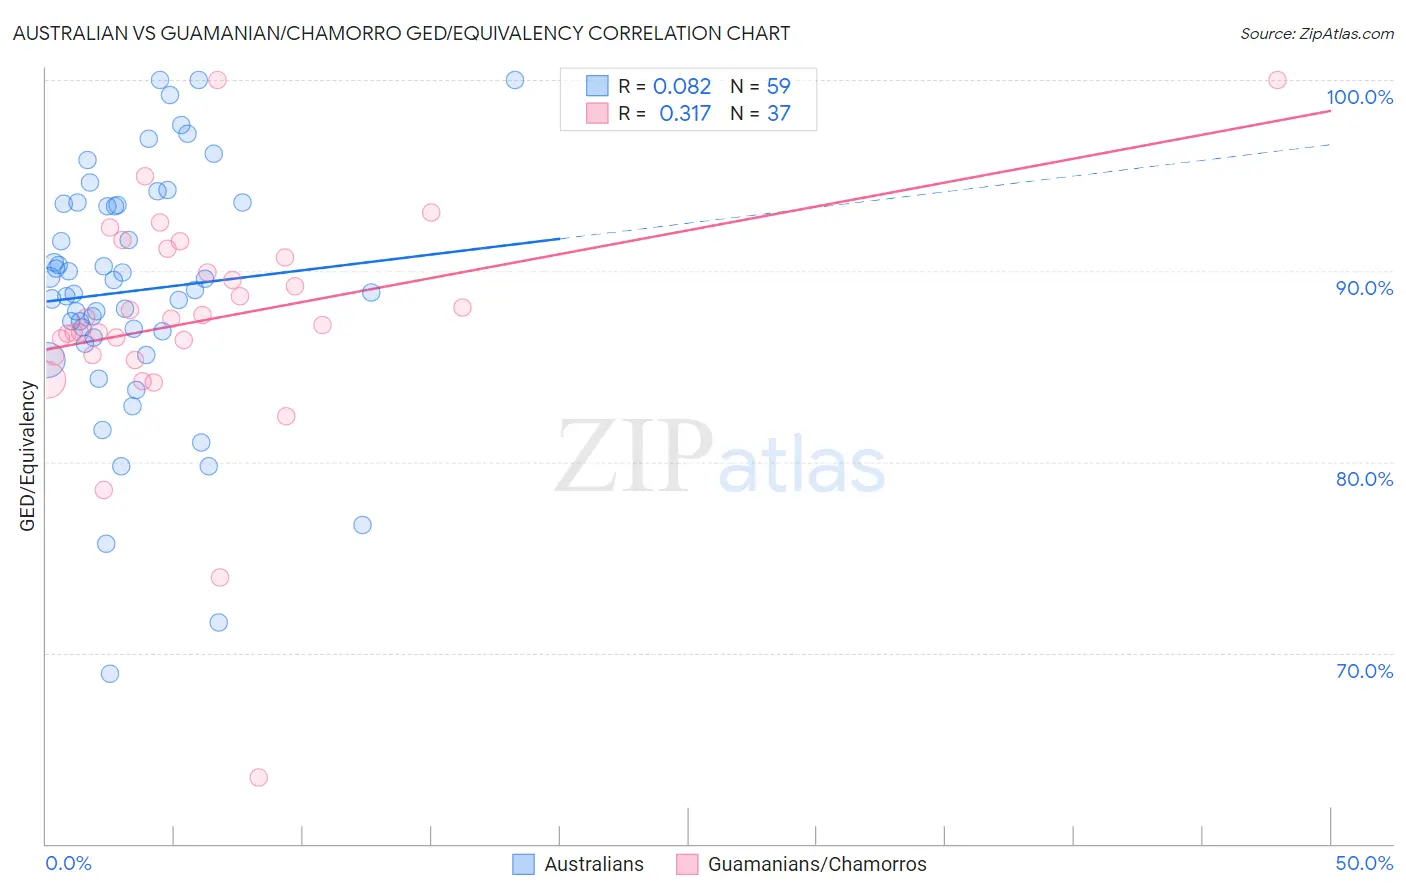
Australian vs Guamanian/Chamorro GED/Equivalency Correlation Chart
The statistical analysis conducted on geographies consisting of 224,163,773 people shows a slight positive correlation between the proportion of Australians and percentage of population with at least ged/equivalency education in the United States with a correlation coefficient (R) of 0.082 and weighted average of 88.1%. Similarly, the statistical analysis conducted on geographies consisting of 221,965,618 people shows a mild positive correlation between the proportion of Guamanians/Chamorros and percentage of population with at least ged/equivalency education in the United States with a correlation coefficient (R) of 0.317 and weighted average of 85.3%, a difference of 3.2%.
GED/Equivalency Correlation Summary
| Measurement | Australian | Guamanian/Chamorro |
| Minimum | 68.9% | 63.5% |
| Maximum | 100.0% | 100.0% |
| Range | 31.1% | 36.5% |
| Mean | 89.0% | 87.4% |
| Median | 89.0% | 87.5% |
| Interquartile 25% (IQ1) | 86.5% | 85.6% |
| Interquartile 75% (IQ3) | 93.6% | 90.9% |
| Interquartile Range (IQR) | 7.0% | 5.3% |
| Standard Deviation (Sample) | 6.5% | 6.3% |
| Standard Deviation (Population) | 6.5% | 6.2% |
Similar Demographics by GED/Equivalency
Demographics Similar to Australians by GED/Equivalency
In terms of ged/equivalency, the demographic groups most similar to Australians are Greek (88.1%, a difference of 0.010%), Immigrants from Korea (88.1%, a difference of 0.010%), Immigrants from Latvia (88.1%, a difference of 0.020%), Immigrants from Switzerland (88.1%, a difference of 0.030%), and Czech (88.1%, a difference of 0.040%).
| Demographics | Rating | Rank | GED/Equivalency |
| Cambodians | 99.6 /100 | #42 | Exceptional 88.2% |
| Immigrants | Scotland | 99.6 /100 | #43 | Exceptional 88.2% |
| Macedonians | 99.5 /100 | #44 | Exceptional 88.1% |
| Czechs | 99.5 /100 | #45 | Exceptional 88.1% |
| Immigrants | Switzerland | 99.5 /100 | #46 | Exceptional 88.1% |
| Immigrants | Latvia | 99.5 /100 | #47 | Exceptional 88.1% |
| Greeks | 99.5 /100 | #48 | Exceptional 88.1% |
| Australians | 99.5 /100 | #49 | Exceptional 88.1% |
| Immigrants | Korea | 99.5 /100 | #50 | Exceptional 88.1% |
| Immigrants | Netherlands | 99.4 /100 | #51 | Exceptional 88.0% |
| Zimbabweans | 99.4 /100 | #52 | Exceptional 88.0% |
| Immigrants | South Africa | 99.4 /100 | #53 | Exceptional 88.0% |
| Soviet Union | 99.4 /100 | #54 | Exceptional 88.0% |
| New Zealanders | 99.4 /100 | #55 | Exceptional 88.0% |
| Immigrants | Denmark | 99.4 /100 | #56 | Exceptional 88.0% |
Demographics Similar to Guamanians/Chamorros by GED/Equivalency
In terms of ged/equivalency, the demographic groups most similar to Guamanians/Chamorros are Immigrants from Sierra Leone (85.4%, a difference of 0.010%), Alaskan Athabascan (85.3%, a difference of 0.020%), Immigrants from Afghanistan (85.4%, a difference of 0.030%), Spaniard (85.4%, a difference of 0.090%), and Spanish (85.4%, a difference of 0.11%).
| Demographics | Rating | Rank | GED/Equivalency |
| Sudanese | 35.2 /100 | #182 | Fair 85.5% |
| Immigrants | Sudan | 34.2 /100 | #183 | Fair 85.5% |
| Immigrants | Oceania | 33.6 /100 | #184 | Fair 85.5% |
| Spanish | 32.8 /100 | #185 | Fair 85.4% |
| Spaniards | 31.9 /100 | #186 | Fair 85.4% |
| Immigrants | Afghanistan | 29.8 /100 | #187 | Fair 85.4% |
| Immigrants | Sierra Leone | 29.0 /100 | #188 | Fair 85.4% |
| Guamanians/Chamorros | 28.4 /100 | #189 | Fair 85.3% |
| Alaskan Athabascans | 27.5 /100 | #190 | Fair 85.3% |
| South American Indians | 22.8 /100 | #191 | Fair 85.2% |
| Immigrants | Nonimmigrants | 22.7 /100 | #192 | Fair 85.2% |
| Delaware | 22.2 /100 | #193 | Fair 85.2% |
| Puget Sound Salish | 20.8 /100 | #194 | Fair 85.2% |
| Chippewa | 20.8 /100 | #195 | Fair 85.2% |
| Tongans | 20.7 /100 | #196 | Fair 85.2% |