Immigrants from Australia vs Guamanian/Chamorro GED/Equivalency
COMPARE
Immigrants from Australia
Guamanian/Chamorro
GED/Equivalency
GED/Equivalency Comparison
Immigrants from Australia
Guamanians/Chamorros
88.6%
GED/EQUIVALENCY
99.8/ 100
METRIC RATING
26th/ 347
METRIC RANK
85.3%
GED/EQUIVALENCY
28.4/ 100
METRIC RATING
189th/ 347
METRIC RANK
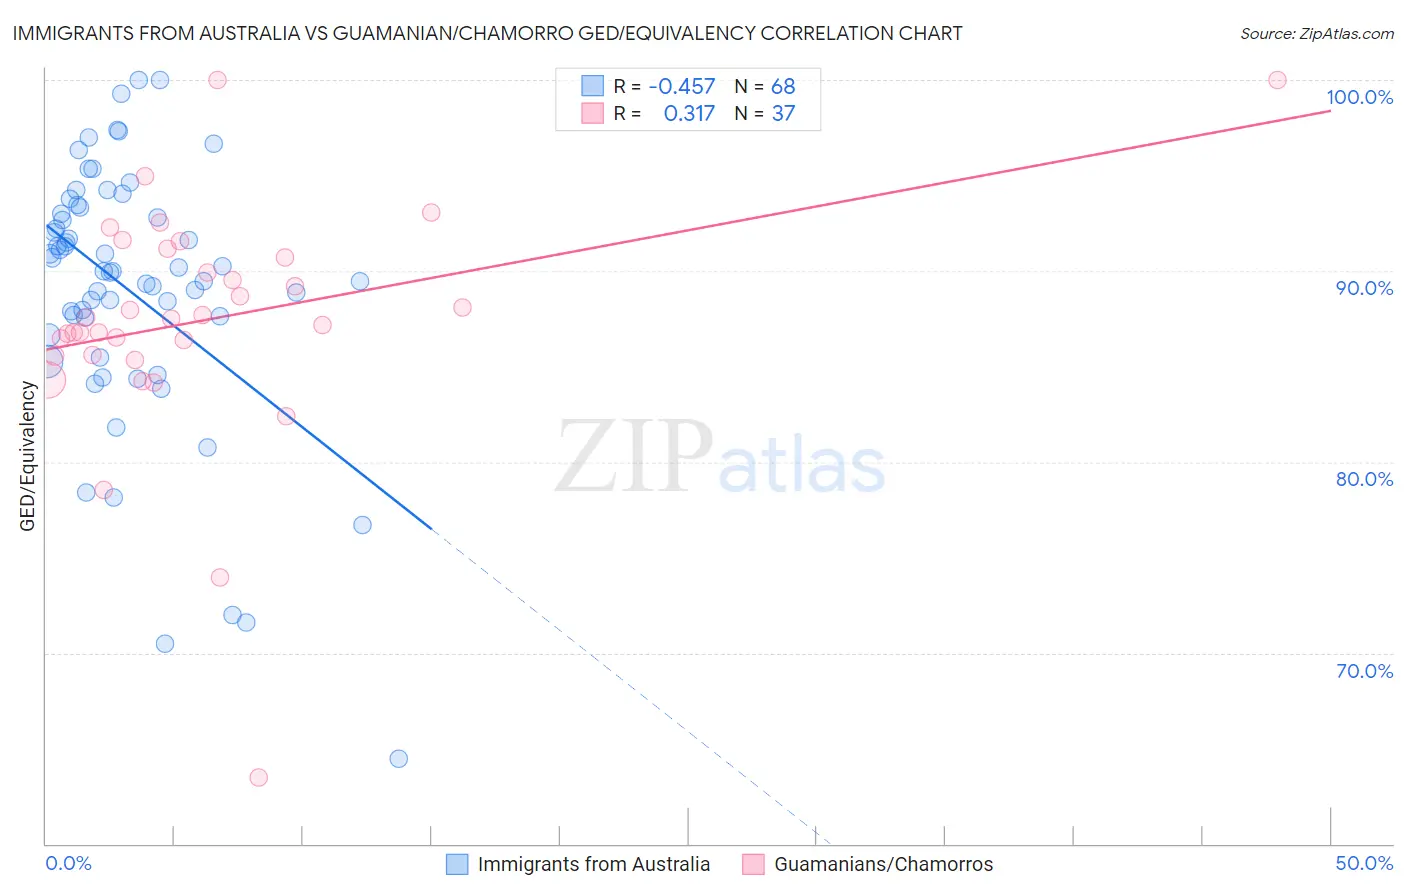
Immigrants from Australia vs Guamanian/Chamorro GED/Equivalency Correlation Chart
The statistical analysis conducted on geographies consisting of 227,202,828 people shows a moderate negative correlation between the proportion of Immigrants from Australia and percentage of population with at least ged/equivalency education in the United States with a correlation coefficient (R) of -0.457 and weighted average of 88.6%. Similarly, the statistical analysis conducted on geographies consisting of 221,965,618 people shows a mild positive correlation between the proportion of Guamanians/Chamorros and percentage of population with at least ged/equivalency education in the United States with a correlation coefficient (R) of 0.317 and weighted average of 85.3%, a difference of 3.8%.
GED/Equivalency Correlation Summary
| Measurement | Immigrants from Australia | Guamanian/Chamorro |
| Minimum | 64.5% | 63.5% |
| Maximum | 100.0% | 100.0% |
| Range | 35.5% | 36.5% |
| Mean | 88.9% | 87.4% |
| Median | 90.0% | 87.5% |
| Interquartile 25% (IQ1) | 87.1% | 85.6% |
| Interquartile 75% (IQ3) | 93.2% | 90.9% |
| Interquartile Range (IQR) | 6.1% | 5.3% |
| Standard Deviation (Sample) | 6.9% | 6.3% |
| Standard Deviation (Population) | 6.9% | 6.2% |
Similar Demographics by GED/Equivalency
Demographics Similar to Immigrants from Australia by GED/Equivalency
In terms of ged/equivalency, the demographic groups most similar to Immigrants from Australia are Slovak (88.6%, a difference of 0.0%), Estonian (88.6%, a difference of 0.0%), Russian (88.6%, a difference of 0.010%), Immigrants from Ireland (88.6%, a difference of 0.020%), and Luxembourger (88.6%, a difference of 0.030%).
| Demographics | Rating | Rank | GED/Equivalency |
| Swedes | 99.9 /100 | #19 | Exceptional 88.8% |
| Maltese | 99.9 /100 | #20 | Exceptional 88.6% |
| Luxembourgers | 99.8 /100 | #21 | Exceptional 88.6% |
| Immigrants | Ireland | 99.8 /100 | #22 | Exceptional 88.6% |
| Russians | 99.8 /100 | #23 | Exceptional 88.6% |
| Slovaks | 99.8 /100 | #24 | Exceptional 88.6% |
| Estonians | 99.8 /100 | #25 | Exceptional 88.6% |
| Immigrants | Australia | 99.8 /100 | #26 | Exceptional 88.6% |
| Immigrants | Lithuania | 99.8 /100 | #27 | Exceptional 88.6% |
| Immigrants | Northern Europe | 99.8 /100 | #28 | Exceptional 88.5% |
| Poles | 99.8 /100 | #29 | Exceptional 88.5% |
| Turks | 99.8 /100 | #30 | Exceptional 88.5% |
| Bhutanese | 99.8 /100 | #31 | Exceptional 88.4% |
| Danes | 99.8 /100 | #32 | Exceptional 88.4% |
| Immigrants | Sweden | 99.7 /100 | #33 | Exceptional 88.4% |
Demographics Similar to Guamanians/Chamorros by GED/Equivalency
In terms of ged/equivalency, the demographic groups most similar to Guamanians/Chamorros are Immigrants from Sierra Leone (85.4%, a difference of 0.010%), Alaskan Athabascan (85.3%, a difference of 0.020%), Immigrants from Afghanistan (85.4%, a difference of 0.030%), Spaniard (85.4%, a difference of 0.090%), and Spanish (85.4%, a difference of 0.11%).
| Demographics | Rating | Rank | GED/Equivalency |
| Sudanese | 35.2 /100 | #182 | Fair 85.5% |
| Immigrants | Sudan | 34.2 /100 | #183 | Fair 85.5% |
| Immigrants | Oceania | 33.6 /100 | #184 | Fair 85.5% |
| Spanish | 32.8 /100 | #185 | Fair 85.4% |
| Spaniards | 31.9 /100 | #186 | Fair 85.4% |
| Immigrants | Afghanistan | 29.8 /100 | #187 | Fair 85.4% |
| Immigrants | Sierra Leone | 29.0 /100 | #188 | Fair 85.4% |
| Guamanians/Chamorros | 28.4 /100 | #189 | Fair 85.3% |
| Alaskan Athabascans | 27.5 /100 | #190 | Fair 85.3% |
| South American Indians | 22.8 /100 | #191 | Fair 85.2% |
| Immigrants | Nonimmigrants | 22.7 /100 | #192 | Fair 85.2% |
| Delaware | 22.2 /100 | #193 | Fair 85.2% |
| Puget Sound Salish | 20.8 /100 | #194 | Fair 85.2% |
| Chippewa | 20.8 /100 | #195 | Fair 85.2% |
| Tongans | 20.7 /100 | #196 | Fair 85.2% |