Zimbabwean vs Slovene Disability Age 5 to 17
COMPARE
Zimbabwean
Slovene
Disability Age 5 to 17
Disability Age 5 to 17 Comparison
Zimbabweans
Slovenes
5.5%
DISABILITY AGE 5 TO 17
67.2/ 100
METRIC RATING
162nd/ 347
METRIC RANK
6.0%
DISABILITY AGE 5 TO 17
0.6/ 100
METRIC RATING
266th/ 347
METRIC RANK
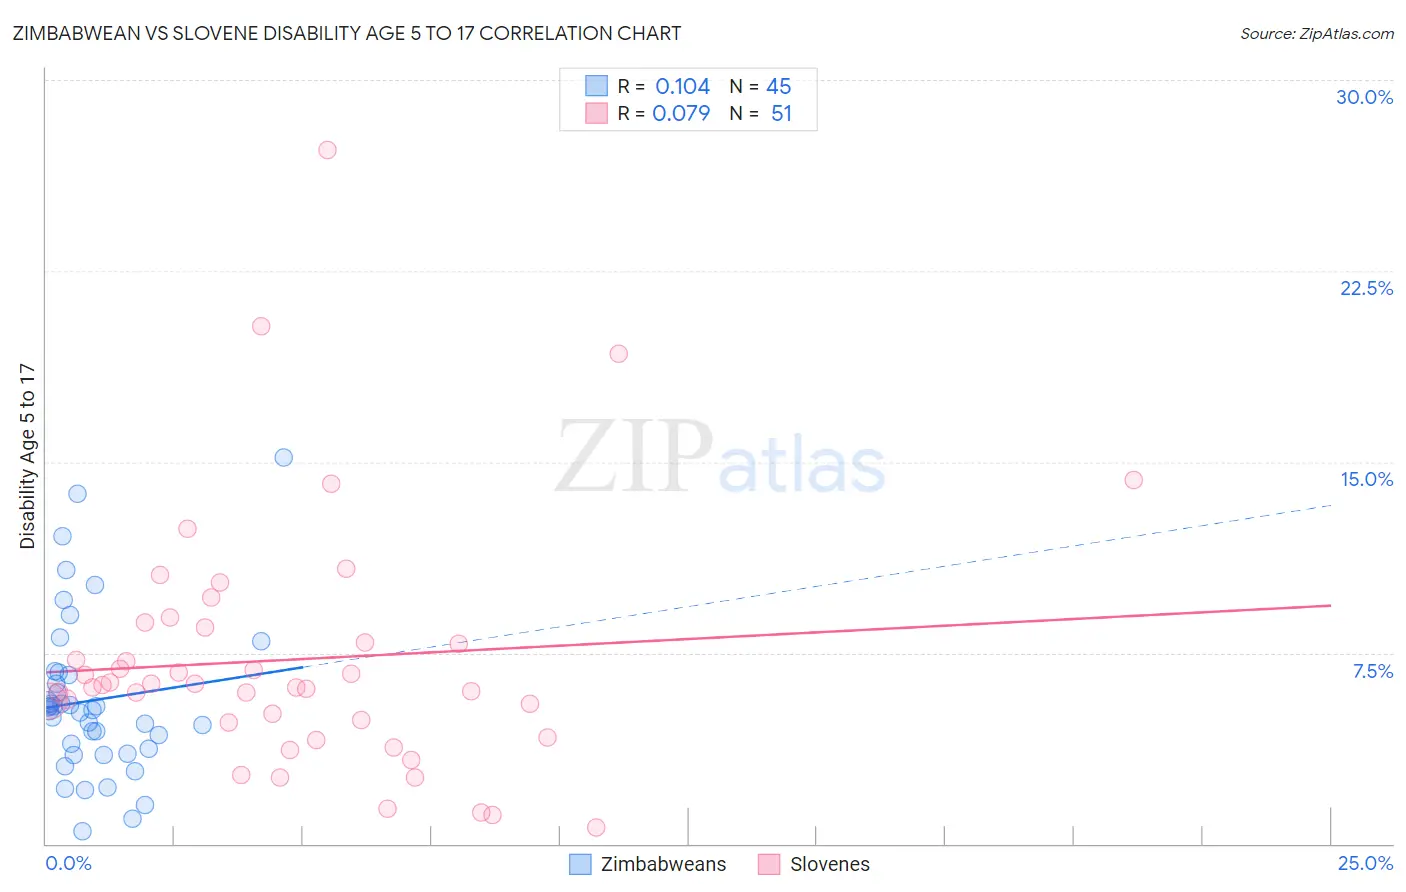
Zimbabwean vs Slovene Disability Age 5 to 17 Correlation Chart
The statistical analysis conducted on geographies consisting of 69,117,127 people shows a poor positive correlation between the proportion of Zimbabweans and percentage of population with a disability between the ages 5 and 17 in the United States with a correlation coefficient (R) of 0.104 and weighted average of 5.5%. Similarly, the statistical analysis conducted on geographies consisting of 259,532,016 people shows a slight positive correlation between the proportion of Slovenes and percentage of population with a disability between the ages 5 and 17 in the United States with a correlation coefficient (R) of 0.079 and weighted average of 6.0%, a difference of 7.3%.
Disability Age 5 to 17 Correlation Summary
| Measurement | Zimbabwean | Slovene |
| Minimum | 0.47% | 0.63% |
| Maximum | 15.2% | 27.3% |
| Range | 14.7% | 26.6% |
| Mean | 5.6% | 7.2% |
| Median | 5.3% | 6.2% |
| Interquartile 25% (IQ1) | 3.6% | 4.8% |
| Interquartile 75% (IQ3) | 6.7% | 8.5% |
| Interquartile Range (IQR) | 3.1% | 3.7% |
| Standard Deviation (Sample) | 3.1% | 4.9% |
| Standard Deviation (Population) | 3.1% | 4.9% |
Similar Demographics by Disability Age 5 to 17
Demographics Similar to Zimbabweans by Disability Age 5 to 17
In terms of disability age 5 to 17, the demographic groups most similar to Zimbabweans are Immigrants from Saudi Arabia (5.5%, a difference of 0.11%), Immigrants from Southern Europe (5.6%, a difference of 0.18%), Immigrants from Scotland (5.6%, a difference of 0.29%), Lebanese (5.6%, a difference of 0.31%), and Greek (5.6%, a difference of 0.36%).
| Demographics | Rating | Rank | Disability Age 5 to 17 |
| Immigrants | Ecuador | 78.3 /100 | #155 | Good 5.5% |
| Hawaiians | 78.0 /100 | #156 | Good 5.5% |
| Immigrants | Costa Rica | 77.9 /100 | #157 | Good 5.5% |
| Immigrants | Nepal | 77.1 /100 | #158 | Good 5.5% |
| Immigrants | Zimbabwe | 75.3 /100 | #159 | Good 5.5% |
| South Africans | 73.3 /100 | #160 | Good 5.5% |
| Immigrants | Saudi Arabia | 69.1 /100 | #161 | Good 5.5% |
| Zimbabweans | 67.2 /100 | #162 | Good 5.5% |
| Immigrants | Southern Europe | 64.0 /100 | #163 | Good 5.6% |
| Immigrants | Scotland | 61.9 /100 | #164 | Good 5.6% |
| Lebanese | 61.4 /100 | #165 | Good 5.6% |
| Greeks | 60.6 /100 | #166 | Good 5.6% |
| Immigrants | Burma/Myanmar | 59.3 /100 | #167 | Average 5.6% |
| Iraqis | 56.0 /100 | #168 | Average 5.6% |
| Immigrants | Norway | 55.7 /100 | #169 | Average 5.6% |
Demographics Similar to Slovenes by Disability Age 5 to 17
In terms of disability age 5 to 17, the demographic groups most similar to Slovenes are Panamanian (6.0%, a difference of 0.030%), Canadian (6.0%, a difference of 0.10%), Spanish (6.0%, a difference of 0.11%), Czechoslovakian (5.9%, a difference of 0.22%), and Immigrants from Western Africa (5.9%, a difference of 0.30%).
| Demographics | Rating | Rank | Disability Age 5 to 17 |
| Slavs | 0.9 /100 | #259 | Tragic 5.9% |
| Somalis | 0.8 /100 | #260 | Tragic 5.9% |
| Immigrants | Middle Africa | 0.7 /100 | #261 | Tragic 5.9% |
| Immigrants | Western Africa | 0.7 /100 | #262 | Tragic 5.9% |
| Czechoslovakians | 0.7 /100 | #263 | Tragic 5.9% |
| Canadians | 0.6 /100 | #264 | Tragic 6.0% |
| Panamanians | 0.6 /100 | #265 | Tragic 6.0% |
| Slovenes | 0.6 /100 | #266 | Tragic 6.0% |
| Spanish | 0.5 /100 | #267 | Tragic 6.0% |
| Sioux | 0.4 /100 | #268 | Tragic 6.0% |
| Liberians | 0.4 /100 | #269 | Tragic 6.0% |
| Immigrants | Somalia | 0.4 /100 | #270 | Tragic 6.0% |
| Immigrants | Zaire | 0.2 /100 | #271 | Tragic 6.0% |
| Finns | 0.2 /100 | #272 | Tragic 6.0% |
| Alaska Natives | 0.2 /100 | #273 | Tragic 6.0% |