Zimbabwean vs Assyrian/Chaldean/Syriac Disability Age 5 to 17
COMPARE
Zimbabwean
Assyrian/Chaldean/Syriac
Disability Age 5 to 17
Disability Age 5 to 17 Comparison
Zimbabweans
Assyrians/Chaldeans/Syriacs
5.5%
DISABILITY AGE 5 TO 17
67.2/ 100
METRIC RATING
162nd/ 347
METRIC RANK
5.0%
DISABILITY AGE 5 TO 17
100.0/ 100
METRIC RATING
46th/ 347
METRIC RANK
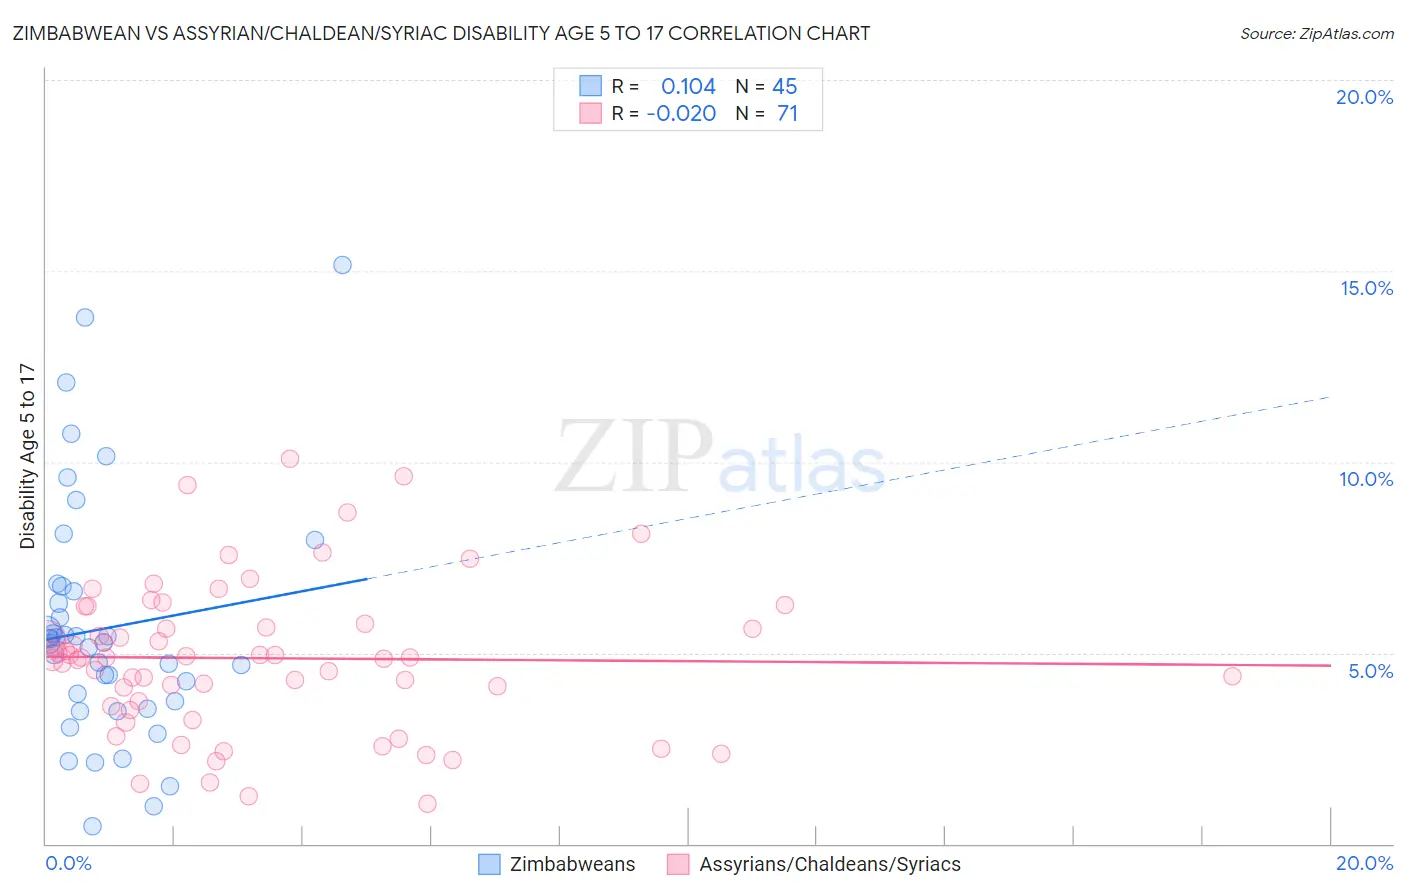
Zimbabwean vs Assyrian/Chaldean/Syriac Disability Age 5 to 17 Correlation Chart
The statistical analysis conducted on geographies consisting of 69,117,127 people shows a poor positive correlation between the proportion of Zimbabweans and percentage of population with a disability between the ages 5 and 17 in the United States with a correlation coefficient (R) of 0.104 and weighted average of 5.5%. Similarly, the statistical analysis conducted on geographies consisting of 110,004,122 people shows no correlation between the proportion of Assyrians/Chaldeans/Syriacs and percentage of population with a disability between the ages 5 and 17 in the United States with a correlation coefficient (R) of -0.020 and weighted average of 5.0%, a difference of 10.0%.
Disability Age 5 to 17 Correlation Summary
| Measurement | Zimbabwean | Assyrian/Chaldean/Syriac |
| Minimum | 0.47% | 1.0% |
| Maximum | 15.2% | 10.1% |
| Range | 14.7% | 9.0% |
| Mean | 5.6% | 4.9% |
| Median | 5.3% | 4.9% |
| Interquartile 25% (IQ1) | 3.6% | 3.6% |
| Interquartile 75% (IQ3) | 6.7% | 5.8% |
| Interquartile Range (IQR) | 3.1% | 2.2% |
| Standard Deviation (Sample) | 3.1% | 2.0% |
| Standard Deviation (Population) | 3.1% | 1.9% |
Similar Demographics by Disability Age 5 to 17
Demographics Similar to Zimbabweans by Disability Age 5 to 17
In terms of disability age 5 to 17, the demographic groups most similar to Zimbabweans are Immigrants from Saudi Arabia (5.5%, a difference of 0.11%), Immigrants from Southern Europe (5.6%, a difference of 0.18%), Immigrants from Scotland (5.6%, a difference of 0.29%), Lebanese (5.6%, a difference of 0.31%), and Greek (5.6%, a difference of 0.36%).
| Demographics | Rating | Rank | Disability Age 5 to 17 |
| Immigrants | Ecuador | 78.3 /100 | #155 | Good 5.5% |
| Hawaiians | 78.0 /100 | #156 | Good 5.5% |
| Immigrants | Costa Rica | 77.9 /100 | #157 | Good 5.5% |
| Immigrants | Nepal | 77.1 /100 | #158 | Good 5.5% |
| Immigrants | Zimbabwe | 75.3 /100 | #159 | Good 5.5% |
| South Africans | 73.3 /100 | #160 | Good 5.5% |
| Immigrants | Saudi Arabia | 69.1 /100 | #161 | Good 5.5% |
| Zimbabweans | 67.2 /100 | #162 | Good 5.5% |
| Immigrants | Southern Europe | 64.0 /100 | #163 | Good 5.6% |
| Immigrants | Scotland | 61.9 /100 | #164 | Good 5.6% |
| Lebanese | 61.4 /100 | #165 | Good 5.6% |
| Greeks | 60.6 /100 | #166 | Good 5.6% |
| Immigrants | Burma/Myanmar | 59.3 /100 | #167 | Average 5.6% |
| Iraqis | 56.0 /100 | #168 | Average 5.6% |
| Immigrants | Norway | 55.7 /100 | #169 | Average 5.6% |
Demographics Similar to Assyrians/Chaldeans/Syriacs by Disability Age 5 to 17
In terms of disability age 5 to 17, the demographic groups most similar to Assyrians/Chaldeans/Syriacs are Tongan (5.0%, a difference of 0.070%), Vietnamese (5.1%, a difference of 0.13%), Egyptian (5.0%, a difference of 0.14%), Immigrants from Russia (5.0%, a difference of 0.18%), and Korean (5.1%, a difference of 0.31%).
| Demographics | Rating | Rank | Disability Age 5 to 17 |
| Immigrants | Argentina | 100.0 /100 | #39 | Exceptional 5.0% |
| Okinawans | 100.0 /100 | #40 | Exceptional 5.0% |
| Immigrants | Australia | 100.0 /100 | #41 | Exceptional 5.0% |
| Immigrants | Sri Lanka | 100.0 /100 | #42 | Exceptional 5.0% |
| Immigrants | Russia | 100.0 /100 | #43 | Exceptional 5.0% |
| Egyptians | 100.0 /100 | #44 | Exceptional 5.0% |
| Tongans | 100.0 /100 | #45 | Exceptional 5.0% |
| Assyrians/Chaldeans/Syriacs | 100.0 /100 | #46 | Exceptional 5.0% |
| Vietnamese | 100.0 /100 | #47 | Exceptional 5.1% |
| Koreans | 100.0 /100 | #48 | Exceptional 5.1% |
| Immigrants | Western Asia | 100.0 /100 | #49 | Exceptional 5.1% |
| Argentineans | 99.9 /100 | #50 | Exceptional 5.1% |
| Turks | 99.9 /100 | #51 | Exceptional 5.1% |
| Immigrants | Fiji | 99.9 /100 | #52 | Exceptional 5.1% |
| Immigrants | Lithuania | 99.9 /100 | #53 | Exceptional 5.1% |