Zimbabwean vs Slovene In Labor Force | Age 45-54
COMPARE
Zimbabwean
Slovene
In Labor Force | Age 45-54
In Labor Force | Age 45-54 Comparison
Zimbabweans
Slovenes
84.0%
IN LABOR FORCE | AGE 45-54
99.9/ 100
METRIC RATING
17th/ 347
METRIC RANK
83.9%
IN LABOR FORCE | AGE 45-54
99.8/ 100
METRIC RATING
24th/ 347
METRIC RANK
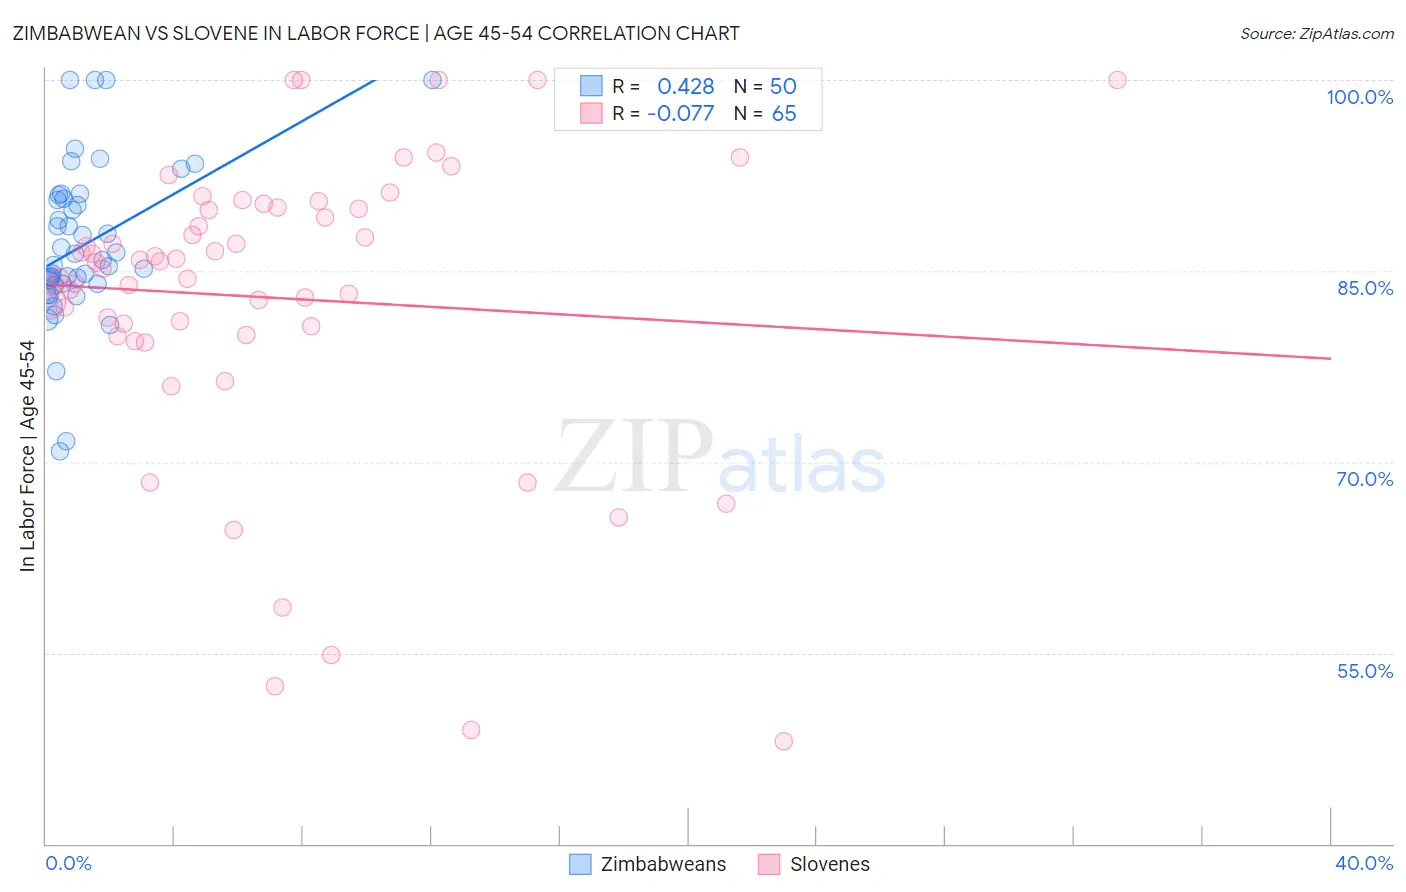
Zimbabwean vs Slovene In Labor Force | Age 45-54 Correlation Chart
The statistical analysis conducted on geographies consisting of 69,187,806 people shows a moderate positive correlation between the proportion of Zimbabweans and labor force participation rate among population between the ages 45 and 54 in the United States with a correlation coefficient (R) of 0.428 and weighted average of 84.0%. Similarly, the statistical analysis conducted on geographies consisting of 261,250,739 people shows a slight negative correlation between the proportion of Slovenes and labor force participation rate among population between the ages 45 and 54 in the United States with a correlation coefficient (R) of -0.077 and weighted average of 83.9%, a difference of 0.14%.
In Labor Force | Age 45-54 Correlation Summary
| Measurement | Zimbabwean | Slovene |
| Minimum | 70.8% | 48.1% |
| Maximum | 100.0% | 100.0% |
| Range | 29.2% | 51.9% |
| Mean | 87.0% | 82.9% |
| Median | 85.7% | 85.6% |
| Interquartile 25% (IQ1) | 84.0% | 80.3% |
| Interquartile 75% (IQ3) | 90.6% | 90.0% |
| Interquartile Range (IQR) | 6.6% | 9.6% |
| Standard Deviation (Sample) | 6.2% | 11.8% |
| Standard Deviation (Population) | 6.1% | 11.7% |
Demographics Similar to Zimbabweans and Slovenes by In Labor Force | Age 45-54
In terms of in labor force | age 45-54, the demographic groups most similar to Zimbabweans are Immigrants from South Central Asia (84.0%, a difference of 0.0%), Immigrants from Nepal (84.0%, a difference of 0.020%), Cypriot (84.1%, a difference of 0.040%), Cambodian (84.1%, a difference of 0.10%), and Czech (83.9%, a difference of 0.11%). Similarly, the demographic groups most similar to Slovenes are Immigrants from Eastern Africa (83.9%, a difference of 0.010%), Immigrants from Sri Lanka (83.9%, a difference of 0.010%), Immigrants from Ireland (83.9%, a difference of 0.010%), Tlingit-Haida (83.9%, a difference of 0.010%), and Czech (83.9%, a difference of 0.030%).
| Demographics | Rating | Rank | In Labor Force | Age 45-54 |
| Norwegians | 100.0 /100 | #10 | Exceptional 84.4% |
| Thais | 100.0 /100 | #11 | Exceptional 84.3% |
| Bulgarians | 100.0 /100 | #12 | Exceptional 84.2% |
| Chinese | 99.9 /100 | #13 | Exceptional 84.1% |
| Cambodians | 99.9 /100 | #14 | Exceptional 84.1% |
| Cypriots | 99.9 /100 | #15 | Exceptional 84.1% |
| Immigrants | Nepal | 99.9 /100 | #16 | Exceptional 84.0% |
| Zimbabweans | 99.9 /100 | #17 | Exceptional 84.0% |
| Immigrants | South Central Asia | 99.9 /100 | #18 | Exceptional 84.0% |
| Czechs | 99.8 /100 | #19 | Exceptional 83.9% |
| Immigrants | Eastern Africa | 99.8 /100 | #20 | Exceptional 83.9% |
| Immigrants | Sri Lanka | 99.8 /100 | #21 | Exceptional 83.9% |
| Immigrants | Ireland | 99.8 /100 | #22 | Exceptional 83.9% |
| Tlingit-Haida | 99.8 /100 | #23 | Exceptional 83.9% |
| Slovenes | 99.8 /100 | #24 | Exceptional 83.9% |
| Immigrants | North Macedonia | 99.8 /100 | #25 | Exceptional 83.9% |
| Immigrants | Serbia | 99.8 /100 | #26 | Exceptional 83.9% |
| Immigrants | Brazil | 99.8 /100 | #27 | Exceptional 83.9% |
| Immigrants | Lithuania | 99.8 /100 | #28 | Exceptional 83.9% |
| Immigrants | Pakistan | 99.7 /100 | #29 | Exceptional 83.8% |
| Immigrants | Bulgaria | 99.7 /100 | #30 | Exceptional 83.8% |