Immigrants from Somalia vs Immigrants from Nicaragua Ambulatory Disability
COMPARE
Immigrants from Somalia
Immigrants from Nicaragua
Ambulatory Disability
Ambulatory Disability Comparison
Immigrants from Somalia
Immigrants from Nicaragua
5.8%
AMBULATORY DISABILITY
98.3/ 100
METRIC RATING
97th/ 347
METRIC RANK
6.1%
AMBULATORY DISABILITY
43.9/ 100
METRIC RATING
180th/ 347
METRIC RANK
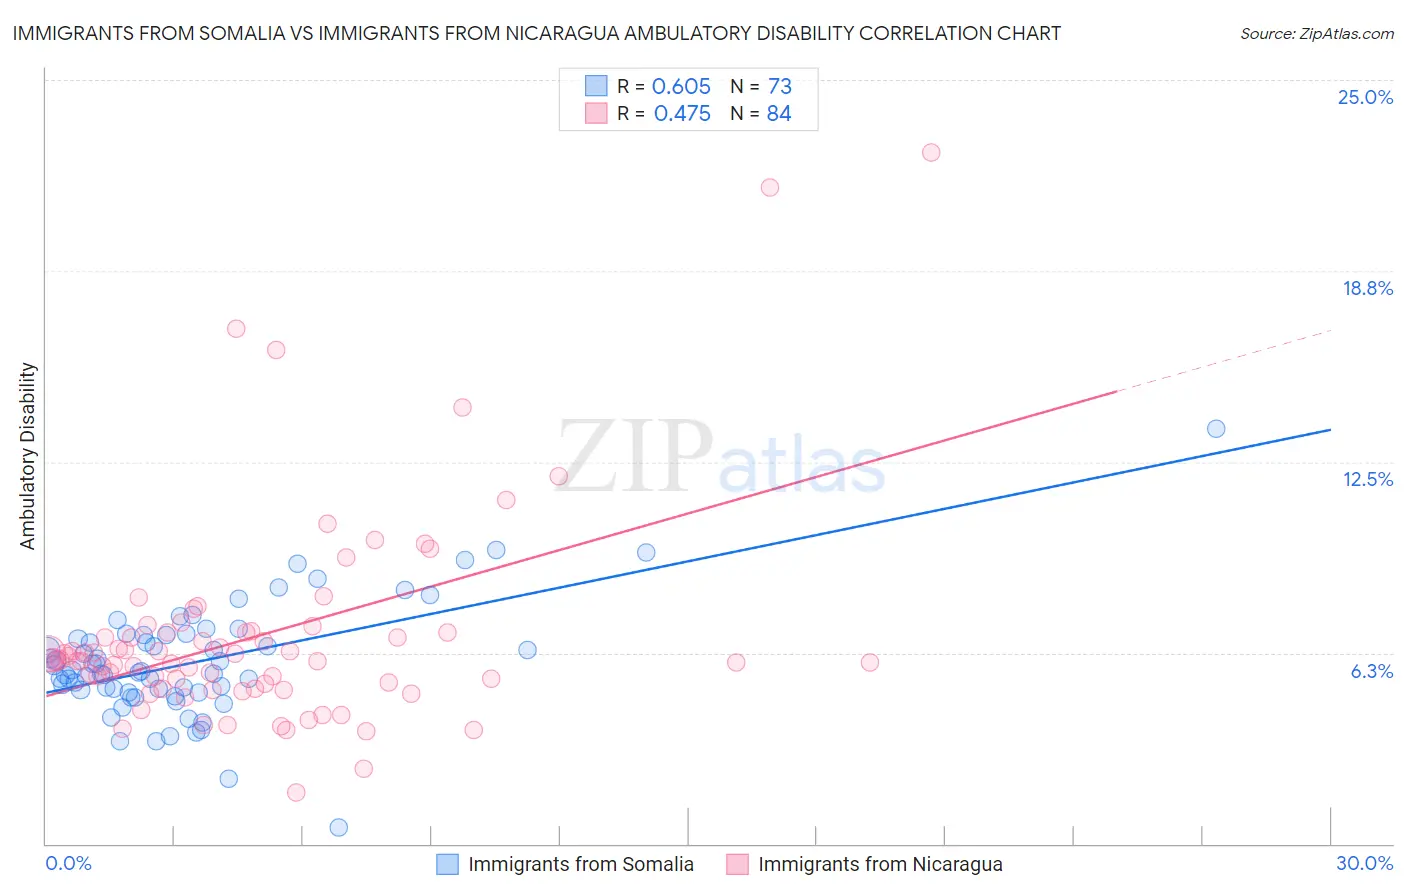
Immigrants from Somalia vs Immigrants from Nicaragua Ambulatory Disability Correlation Chart
The statistical analysis conducted on geographies consisting of 92,104,966 people shows a significant positive correlation between the proportion of Immigrants from Somalia and percentage of population with ambulatory disability in the United States with a correlation coefficient (R) of 0.605 and weighted average of 5.8%. Similarly, the statistical analysis conducted on geographies consisting of 236,322,252 people shows a moderate positive correlation between the proportion of Immigrants from Nicaragua and percentage of population with ambulatory disability in the United States with a correlation coefficient (R) of 0.475 and weighted average of 6.1%, a difference of 6.0%.
Ambulatory Disability Correlation Summary
| Measurement | Immigrants from Somalia | Immigrants from Nicaragua |
| Minimum | 0.52% | 1.7% |
| Maximum | 13.6% | 22.6% |
| Range | 13.1% | 20.9% |
| Mean | 5.9% | 6.8% |
| Median | 5.7% | 6.0% |
| Interquartile 25% (IQ1) | 5.0% | 5.2% |
| Interquartile 75% (IQ3) | 6.8% | 6.9% |
| Interquartile Range (IQR) | 1.8% | 1.7% |
| Standard Deviation (Sample) | 1.9% | 3.5% |
| Standard Deviation (Population) | 1.9% | 3.5% |
Similar Demographics by Ambulatory Disability
Demographics Similar to Immigrants from Somalia by Ambulatory Disability
In terms of ambulatory disability, the demographic groups most similar to Immigrants from Somalia are Immigrants from Lebanon (5.8%, a difference of 0.020%), Salvadoran (5.8%, a difference of 0.040%), Immigrants from El Salvador (5.8%, a difference of 0.060%), Kenyan (5.8%, a difference of 0.10%), and Immigrants from Northern Europe (5.8%, a difference of 0.11%).
| Demographics | Rating | Rank | Ambulatory Disability |
| Australians | 98.8 /100 | #90 | Exceptional 5.8% |
| Immigrants | Sudan | 98.8 /100 | #91 | Exceptional 5.8% |
| Immigrants | Sierra Leone | 98.6 /100 | #92 | Exceptional 5.8% |
| Immigrants | Denmark | 98.6 /100 | #93 | Exceptional 5.8% |
| Kenyans | 98.4 /100 | #94 | Exceptional 5.8% |
| Immigrants | El Salvador | 98.4 /100 | #95 | Exceptional 5.8% |
| Salvadorans | 98.4 /100 | #96 | Exceptional 5.8% |
| Immigrants | Somalia | 98.3 /100 | #97 | Exceptional 5.8% |
| Immigrants | Lebanon | 98.3 /100 | #98 | Exceptional 5.8% |
| Immigrants | Northern Europe | 98.2 /100 | #99 | Exceptional 5.8% |
| Immigrants | Serbia | 97.9 /100 | #100 | Exceptional 5.8% |
| Immigrants | South America | 97.9 /100 | #101 | Exceptional 5.8% |
| Immigrants | Kenya | 97.8 /100 | #102 | Exceptional 5.8% |
| Immigrants | Romania | 97.7 /100 | #103 | Exceptional 5.8% |
| New Zealanders | 97.6 /100 | #104 | Exceptional 5.8% |
Demographics Similar to Immigrants from Nicaragua by Ambulatory Disability
In terms of ambulatory disability, the demographic groups most similar to Immigrants from Nicaragua are Austrian (6.1%, a difference of 0.010%), Scandinavian (6.1%, a difference of 0.030%), Swiss (6.1%, a difference of 0.040%), Serbian (6.1%, a difference of 0.060%), and Immigrants from England (6.1%, a difference of 0.080%).
| Demographics | Rating | Rank | Ambulatory Disability |
| Croatians | 51.2 /100 | #173 | Average 6.1% |
| Immigrants | Canada | 50.0 /100 | #174 | Average 6.1% |
| Vietnamese | 47.2 /100 | #175 | Average 6.1% |
| Immigrants | North America | 45.6 /100 | #176 | Average 6.1% |
| Immigrants | England | 45.4 /100 | #177 | Average 6.1% |
| Scandinavians | 44.5 /100 | #178 | Average 6.1% |
| Austrians | 44.1 /100 | #179 | Average 6.1% |
| Immigrants | Nicaragua | 43.9 /100 | #180 | Average 6.1% |
| Swiss | 43.1 /100 | #181 | Average 6.1% |
| Serbians | 42.8 /100 | #182 | Average 6.1% |
| Immigrants | Thailand | 42.2 /100 | #183 | Average 6.1% |
| Immigrants | Ghana | 41.2 /100 | #184 | Average 6.1% |
| Immigrants | Bosnia and Herzegovina | 37.2 /100 | #185 | Fair 6.2% |
| Europeans | 36.2 /100 | #186 | Fair 6.2% |
| Carpatho Rusyns | 35.3 /100 | #187 | Fair 6.2% |