Maltese vs Immigrants from Nicaragua Ambulatory Disability
COMPARE
Maltese
Immigrants from Nicaragua
Ambulatory Disability
Ambulatory Disability Comparison
Maltese
Immigrants from Nicaragua
6.0%
AMBULATORY DISABILITY
81.6/ 100
METRIC RATING
150th/ 347
METRIC RANK
6.1%
AMBULATORY DISABILITY
43.9/ 100
METRIC RATING
180th/ 347
METRIC RANK
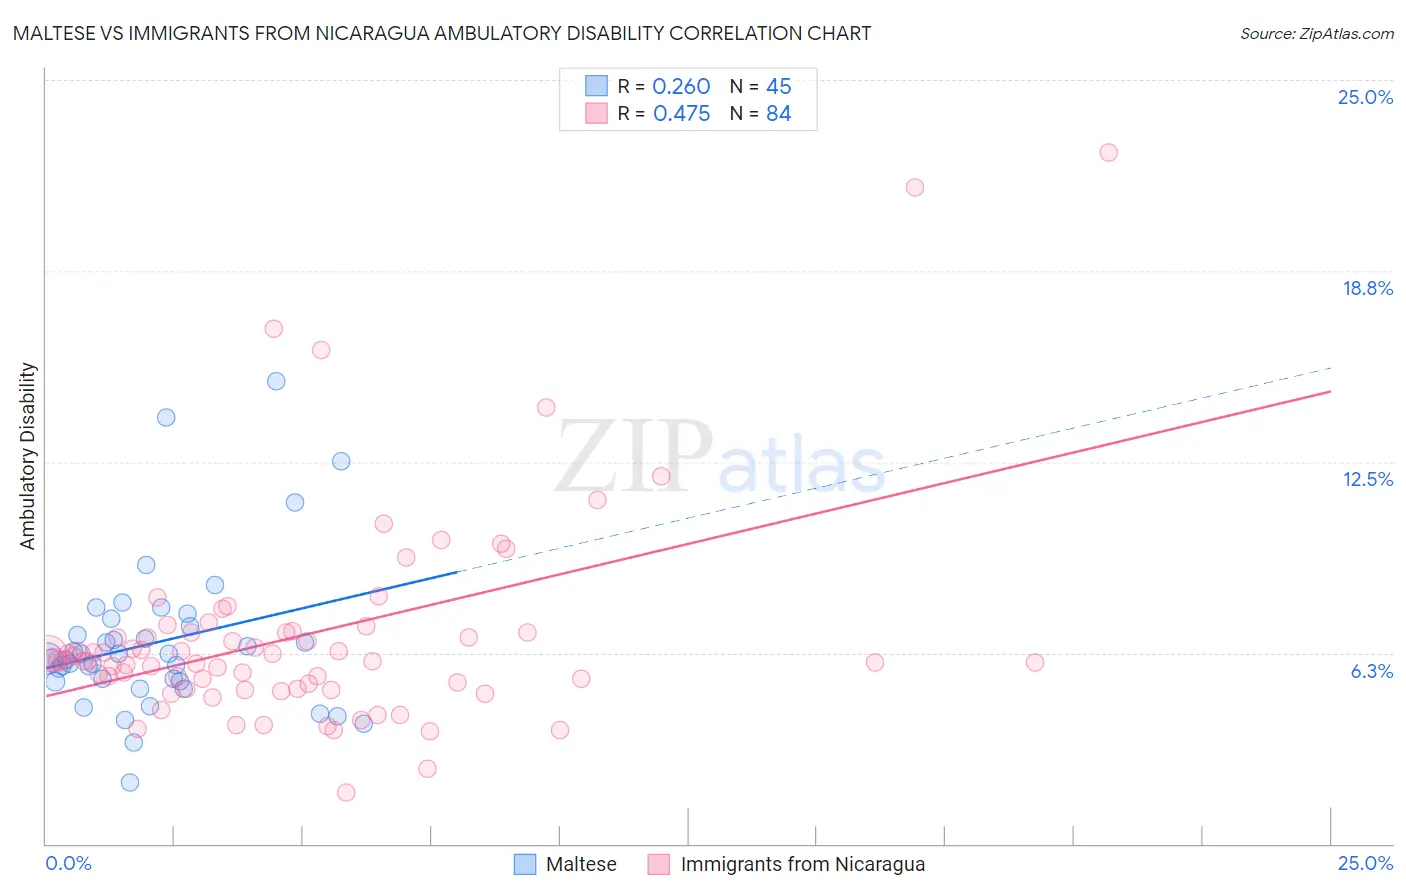
Maltese vs Immigrants from Nicaragua Ambulatory Disability Correlation Chart
The statistical analysis conducted on geographies consisting of 126,465,300 people shows a weak positive correlation between the proportion of Maltese and percentage of population with ambulatory disability in the United States with a correlation coefficient (R) of 0.260 and weighted average of 6.0%. Similarly, the statistical analysis conducted on geographies consisting of 236,322,252 people shows a moderate positive correlation between the proportion of Immigrants from Nicaragua and percentage of population with ambulatory disability in the United States with a correlation coefficient (R) of 0.475 and weighted average of 6.1%, a difference of 2.4%.
Ambulatory Disability Correlation Summary
| Measurement | Maltese | Immigrants from Nicaragua |
| Minimum | 2.0% | 1.7% |
| Maximum | 15.2% | 22.6% |
| Range | 13.2% | 20.9% |
| Mean | 6.6% | 6.8% |
| Median | 6.1% | 6.0% |
| Interquartile 25% (IQ1) | 5.3% | 5.2% |
| Interquartile 75% (IQ3) | 7.2% | 6.9% |
| Interquartile Range (IQR) | 1.9% | 1.7% |
| Standard Deviation (Sample) | 2.5% | 3.5% |
| Standard Deviation (Population) | 2.5% | 3.5% |
Similar Demographics by Ambulatory Disability
Demographics Similar to Maltese by Ambulatory Disability
In terms of ambulatory disability, the demographic groups most similar to Maltese are Lithuanian (6.0%, a difference of 0.020%), Immigrants from Eastern Europe (6.0%, a difference of 0.030%), Immigrants from Moldova (6.0%, a difference of 0.070%), Pakistani (6.0%, a difference of 0.080%), and Immigrants from Greece (6.0%, a difference of 0.080%).
| Demographics | Rating | Rank | Ambulatory Disability |
| Romanians | 82.9 /100 | #143 | Excellent 6.0% |
| Macedonians | 82.8 /100 | #144 | Excellent 6.0% |
| Pakistanis | 82.5 /100 | #145 | Excellent 6.0% |
| Immigrants | Greece | 82.5 /100 | #146 | Excellent 6.0% |
| Immigrants | Moldova | 82.4 /100 | #147 | Excellent 6.0% |
| Immigrants | Eastern Europe | 82.0 /100 | #148 | Excellent 6.0% |
| Lithuanians | 81.9 /100 | #149 | Excellent 6.0% |
| Maltese | 81.6 /100 | #150 | Excellent 6.0% |
| Greeks | 79.6 /100 | #151 | Good 6.0% |
| Immigrants | Austria | 78.8 /100 | #152 | Good 6.0% |
| Syrians | 75.5 /100 | #153 | Good 6.0% |
| Immigrants | Croatia | 75.1 /100 | #154 | Good 6.0% |
| Immigrants | Scotland | 72.1 /100 | #155 | Good 6.0% |
| Northern Europeans | 71.8 /100 | #156 | Good 6.0% |
| Ghanaians | 71.3 /100 | #157 | Good 6.0% |
Demographics Similar to Immigrants from Nicaragua by Ambulatory Disability
In terms of ambulatory disability, the demographic groups most similar to Immigrants from Nicaragua are Austrian (6.1%, a difference of 0.010%), Scandinavian (6.1%, a difference of 0.030%), Swiss (6.1%, a difference of 0.040%), Serbian (6.1%, a difference of 0.060%), and Immigrants from England (6.1%, a difference of 0.080%).
| Demographics | Rating | Rank | Ambulatory Disability |
| Croatians | 51.2 /100 | #173 | Average 6.1% |
| Immigrants | Canada | 50.0 /100 | #174 | Average 6.1% |
| Vietnamese | 47.2 /100 | #175 | Average 6.1% |
| Immigrants | North America | 45.6 /100 | #176 | Average 6.1% |
| Immigrants | England | 45.4 /100 | #177 | Average 6.1% |
| Scandinavians | 44.5 /100 | #178 | Average 6.1% |
| Austrians | 44.1 /100 | #179 | Average 6.1% |
| Immigrants | Nicaragua | 43.9 /100 | #180 | Average 6.1% |
| Swiss | 43.1 /100 | #181 | Average 6.1% |
| Serbians | 42.8 /100 | #182 | Average 6.1% |
| Immigrants | Thailand | 42.2 /100 | #183 | Average 6.1% |
| Immigrants | Ghana | 41.2 /100 | #184 | Average 6.1% |
| Immigrants | Bosnia and Herzegovina | 37.2 /100 | #185 | Fair 6.2% |
| Europeans | 36.2 /100 | #186 | Fair 6.2% |
| Carpatho Rusyns | 35.3 /100 | #187 | Fair 6.2% |