Zimbabwean vs Immigrants from Nicaragua Per Capita Income
COMPARE
Zimbabwean
Immigrants from Nicaragua
Per Capita Income
Per Capita Income Comparison
Zimbabweans
Immigrants from Nicaragua
$45,804
PER CAPITA INCOME
91.7/ 100
METRIC RATING
125th/ 347
METRIC RANK
$38,065
PER CAPITA INCOME
0.2/ 100
METRIC RATING
278th/ 347
METRIC RANK
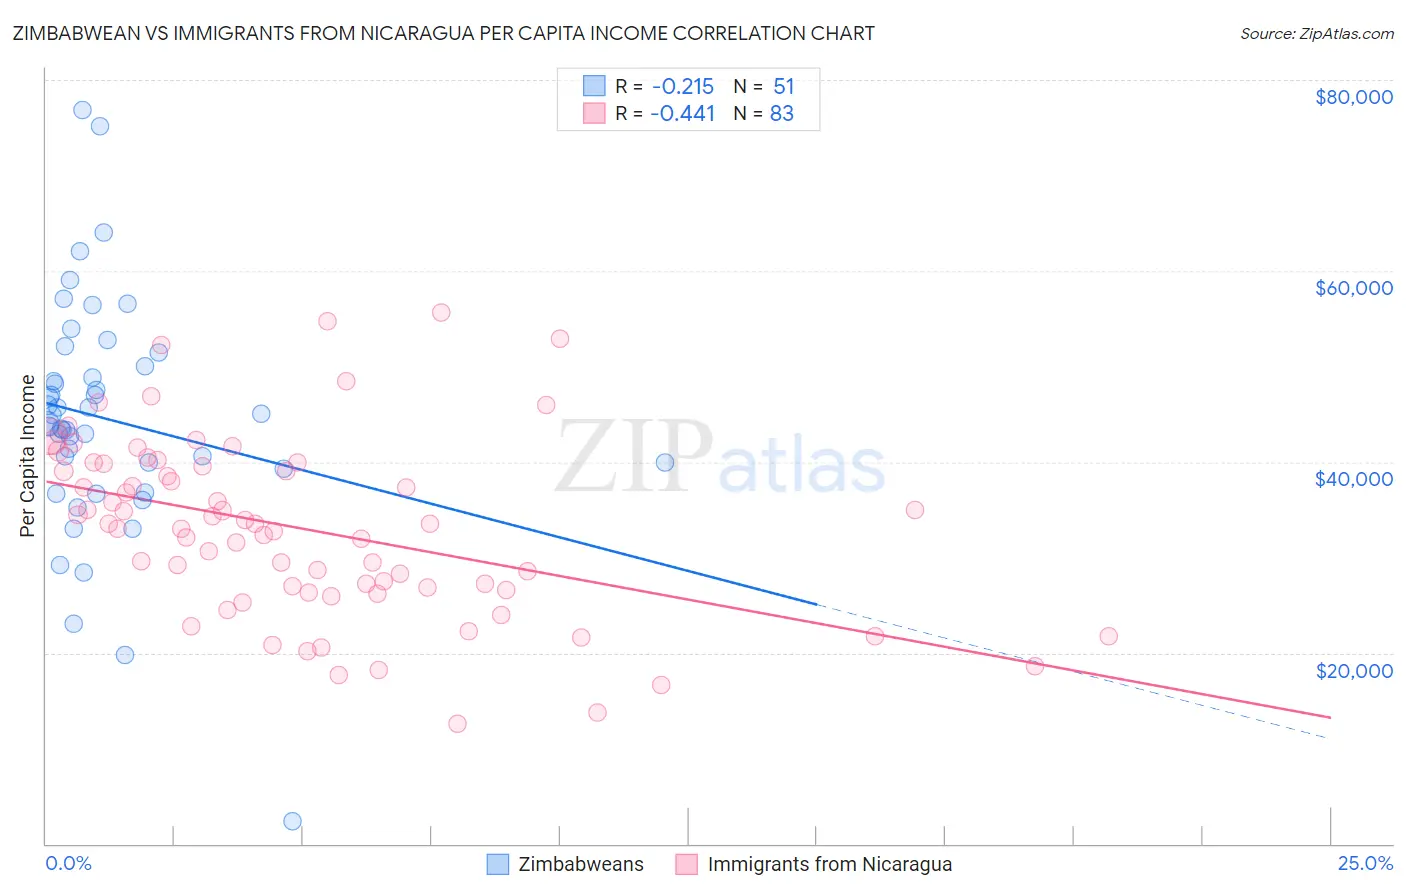
Zimbabwean vs Immigrants from Nicaragua Per Capita Income Correlation Chart
The statistical analysis conducted on geographies consisting of 69,200,621 people shows a weak negative correlation between the proportion of Zimbabweans and per capita income in the United States with a correlation coefficient (R) of -0.215 and weighted average of $45,804. Similarly, the statistical analysis conducted on geographies consisting of 236,340,517 people shows a moderate negative correlation between the proportion of Immigrants from Nicaragua and per capita income in the United States with a correlation coefficient (R) of -0.441 and weighted average of $38,065, a difference of 20.3%.
Per Capita Income Correlation Summary
| Measurement | Zimbabwean | Immigrants from Nicaragua |
| Minimum | $2,302 | $12,549 |
| Maximum | $76,842 | $55,632 |
| Range | $74,540 | $43,083 |
| Mean | $44,445 | $33,018 |
| Median | $44,038 | $33,470 |
| Interquartile 25% (IQ1) | $39,330 | $26,578 |
| Interquartile 75% (IQ3) | $50,052 | $39,762 |
| Interquartile Range (IQR) | $10,722 | $13,184 |
| Standard Deviation (Sample) | $12,469 | $9,366 |
| Standard Deviation (Population) | $12,346 | $9,309 |
Similar Demographics by Per Capita Income
Demographics Similar to Zimbabweans by Per Capita Income
In terms of per capita income, the demographic groups most similar to Zimbabweans are Palestinian ($45,790, a difference of 0.030%), European ($45,836, a difference of 0.070%), Lebanese ($45,840, a difference of 0.080%), Moroccan ($45,854, a difference of 0.11%), and Canadian ($45,858, a difference of 0.12%).
| Demographics | Rating | Rank | Per Capita Income |
| Immigrants | Saudi Arabia | 93.3 /100 | #118 | Exceptional $46,008 |
| Immigrants | Poland | 93.1 /100 | #119 | Exceptional $45,979 |
| Immigrants | Ethiopia | 92.7 /100 | #120 | Exceptional $45,923 |
| Canadians | 92.2 /100 | #121 | Exceptional $45,858 |
| Moroccans | 92.1 /100 | #122 | Exceptional $45,854 |
| Lebanese | 92.0 /100 | #123 | Exceptional $45,840 |
| Europeans | 92.0 /100 | #124 | Exceptional $45,836 |
| Zimbabweans | 91.7 /100 | #125 | Exceptional $45,804 |
| Palestinians | 91.6 /100 | #126 | Exceptional $45,790 |
| Immigrants | Germany | 91.3 /100 | #127 | Exceptional $45,751 |
| Swedes | 91.3 /100 | #128 | Exceptional $45,750 |
| Luxembourgers | 90.4 /100 | #129 | Exceptional $45,663 |
| Arabs | 90.4 /100 | #130 | Exceptional $45,662 |
| Immigrants | North Macedonia | 90.0 /100 | #131 | Exceptional $45,622 |
| Jordanians | 89.9 /100 | #132 | Excellent $45,605 |
Demographics Similar to Immigrants from Nicaragua by Per Capita Income
In terms of per capita income, the demographic groups most similar to Immigrants from Nicaragua are Colville ($38,047, a difference of 0.050%), Potawatomi ($38,046, a difference of 0.050%), Comanche ($38,088, a difference of 0.060%), Hmong ($38,120, a difference of 0.15%), and Immigrants from Liberia ($38,165, a difference of 0.26%).
| Demographics | Rating | Rank | Per Capita Income |
| Central Americans | 0.3 /100 | #271 | Tragic $38,560 |
| Immigrants | Cabo Verde | 0.3 /100 | #272 | Tragic $38,540 |
| Nepalese | 0.3 /100 | #273 | Tragic $38,442 |
| Immigrants | El Salvador | 0.3 /100 | #274 | Tragic $38,394 |
| Immigrants | Liberia | 0.2 /100 | #275 | Tragic $38,165 |
| Hmong | 0.2 /100 | #276 | Tragic $38,120 |
| Comanche | 0.2 /100 | #277 | Tragic $38,088 |
| Immigrants | Nicaragua | 0.2 /100 | #278 | Tragic $38,065 |
| Colville | 0.2 /100 | #279 | Tragic $38,047 |
| Potawatomi | 0.2 /100 | #280 | Tragic $38,046 |
| Immigrants | Dominica | 0.2 /100 | #281 | Tragic $37,952 |
| Immigrants | Laos | 0.1 /100 | #282 | Tragic $37,857 |
| Pennsylvania Germans | 0.1 /100 | #283 | Tragic $37,842 |
| Africans | 0.1 /100 | #284 | Tragic $37,785 |
| Guatemalans | 0.1 /100 | #285 | Tragic $37,766 |