Yup'ik vs Immigrants from Ecuador Male Disability
COMPARE
Yup'ik
Immigrants from Ecuador
Male Disability
Male Disability Comparison
Yup'ik
Immigrants from Ecuador
12.8%
MALE DISABILITY
0.0/ 100
METRIC RATING
288th/ 347
METRIC RANK
10.4%
MALE DISABILITY
99.3/ 100
METRIC RATING
62nd/ 347
METRIC RANK
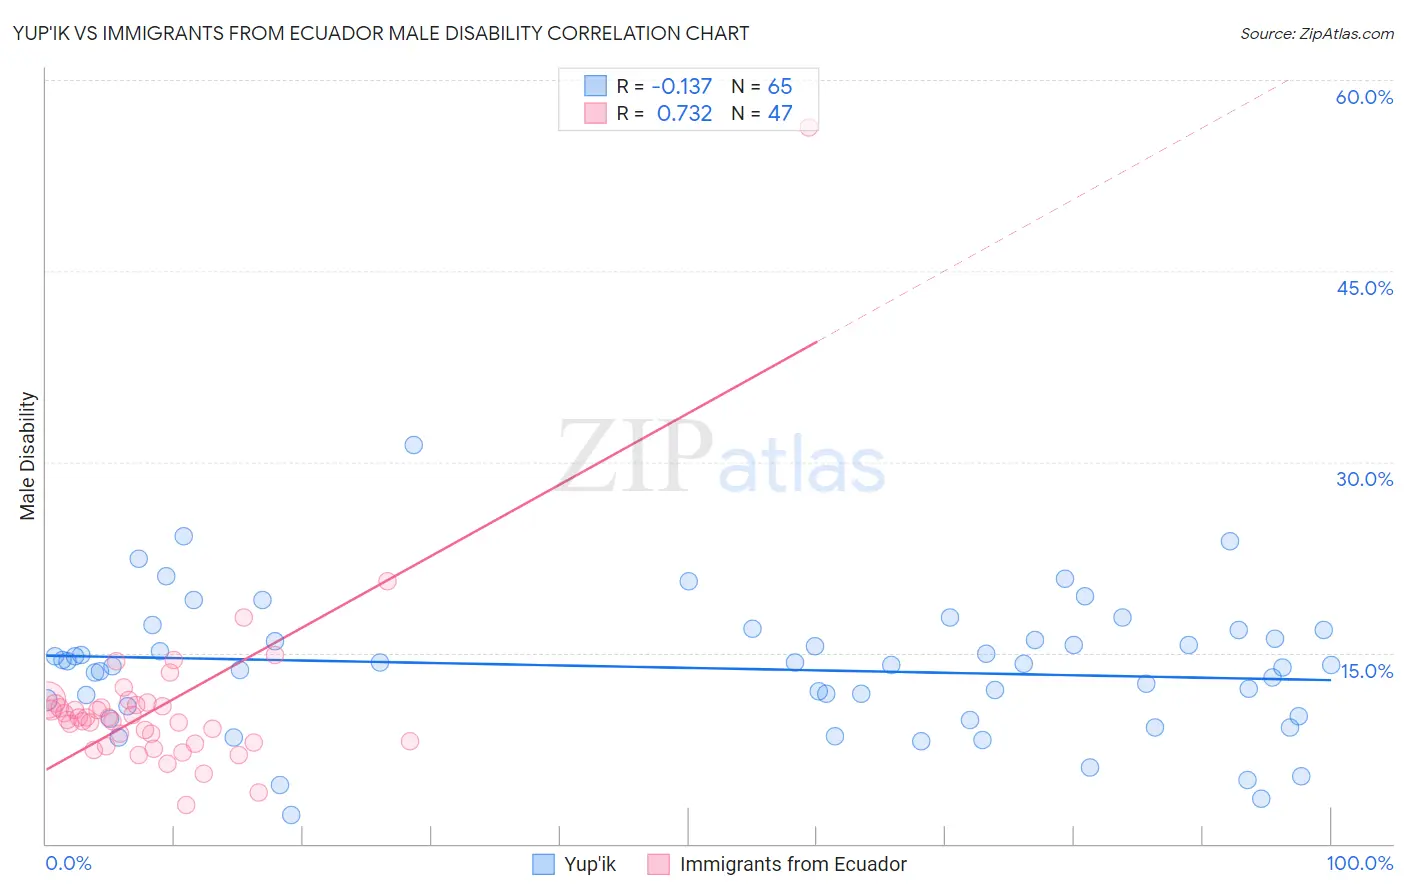
Yup'ik vs Immigrants from Ecuador Male Disability Correlation Chart
The statistical analysis conducted on geographies consisting of 39,960,861 people shows a poor negative correlation between the proportion of Yup'ik and percentage of males with a disability in the United States with a correlation coefficient (R) of -0.137 and weighted average of 12.8%. Similarly, the statistical analysis conducted on geographies consisting of 270,973,645 people shows a strong positive correlation between the proportion of Immigrants from Ecuador and percentage of males with a disability in the United States with a correlation coefficient (R) of 0.732 and weighted average of 10.4%, a difference of 22.5%.
Male Disability Correlation Summary
| Measurement | Yup'ik | Immigrants from Ecuador |
| Minimum | 2.3% | 3.0% |
| Maximum | 31.3% | 56.2% |
| Range | 29.0% | 53.3% |
| Mean | 13.8% | 10.9% |
| Median | 14.1% | 9.9% |
| Interquartile 25% (IQ1) | 10.4% | 8.0% |
| Interquartile 75% (IQ3) | 16.4% | 11.0% |
| Interquartile Range (IQR) | 6.0% | 3.1% |
| Standard Deviation (Sample) | 5.2% | 7.4% |
| Standard Deviation (Population) | 5.2% | 7.4% |
Similar Demographics by Male Disability
Demographics Similar to Yup'ik by Male Disability
In terms of male disability, the demographic groups most similar to Yup'ik are Cape Verdean (12.8%, a difference of 0.19%), Immigrants from Cabo Verde (12.8%, a difference of 0.19%), Scottish (12.8%, a difference of 0.26%), Spanish (12.7%, a difference of 0.31%), and Welsh (12.7%, a difference of 0.31%).
| Demographics | Rating | Rank | Male Disability |
| Sioux | 0.0 /100 | #281 | Tragic 12.7% |
| Irish | 0.0 /100 | #282 | Tragic 12.7% |
| Germans | 0.0 /100 | #283 | Tragic 12.7% |
| Spanish | 0.0 /100 | #284 | Tragic 12.7% |
| Welsh | 0.0 /100 | #285 | Tragic 12.7% |
| Scottish | 0.0 /100 | #286 | Tragic 12.8% |
| Cape Verdeans | 0.0 /100 | #287 | Tragic 12.8% |
| Yup'ik | 0.0 /100 | #288 | Tragic 12.8% |
| Immigrants | Cabo Verde | 0.0 /100 | #289 | Tragic 12.8% |
| Pima | 0.0 /100 | #290 | Tragic 12.8% |
| Whites/Caucasians | 0.0 /100 | #291 | Tragic 12.8% |
| English | 0.0 /100 | #292 | Tragic 12.8% |
| Yaqui | 0.0 /100 | #293 | Tragic 12.9% |
| Marshallese | 0.0 /100 | #294 | Tragic 12.9% |
| Immigrants | Micronesia | 0.0 /100 | #295 | Tragic 12.9% |
Demographics Similar to Immigrants from Ecuador by Male Disability
In terms of male disability, the demographic groups most similar to Immigrants from Ecuador are Immigrants from Belarus (10.4%, a difference of 0.020%), Jordanian (10.5%, a difference of 0.15%), Immigrants from Grenada (10.5%, a difference of 0.17%), Guyanese (10.5%, a difference of 0.17%), and Immigrants from Afghanistan (10.5%, a difference of 0.18%).
| Demographics | Rating | Rank | Male Disability |
| Immigrants | Eritrea | 99.6 /100 | #55 | Exceptional 10.4% |
| Tongans | 99.6 /100 | #56 | Exceptional 10.4% |
| Immigrants | South America | 99.6 /100 | #57 | Exceptional 10.4% |
| Immigrants | Japan | 99.5 /100 | #58 | Exceptional 10.4% |
| Immigrants | Australia | 99.5 /100 | #59 | Exceptional 10.4% |
| Immigrants | Colombia | 99.5 /100 | #60 | Exceptional 10.4% |
| Immigrants | Northern Africa | 99.4 /100 | #61 | Exceptional 10.4% |
| Immigrants | Ecuador | 99.3 /100 | #62 | Exceptional 10.4% |
| Immigrants | Belarus | 99.3 /100 | #63 | Exceptional 10.4% |
| Jordanians | 99.3 /100 | #64 | Exceptional 10.5% |
| Immigrants | Grenada | 99.2 /100 | #65 | Exceptional 10.5% |
| Guyanese | 99.2 /100 | #66 | Exceptional 10.5% |
| Immigrants | Afghanistan | 99.2 /100 | #67 | Exceptional 10.5% |
| Colombians | 99.2 /100 | #68 | Exceptional 10.5% |
| Ecuadorians | 99.2 /100 | #69 | Exceptional 10.5% |