Yup'ik vs Latvian Male Disability
COMPARE
Yup'ik
Latvian
Male Disability
Male Disability Comparison
Yup'ik
Latvians
12.8%
MALE DISABILITY
0.0/ 100
METRIC RATING
288th/ 347
METRIC RANK
11.1%
MALE DISABILITY
68.1/ 100
METRIC RATING
158th/ 347
METRIC RANK
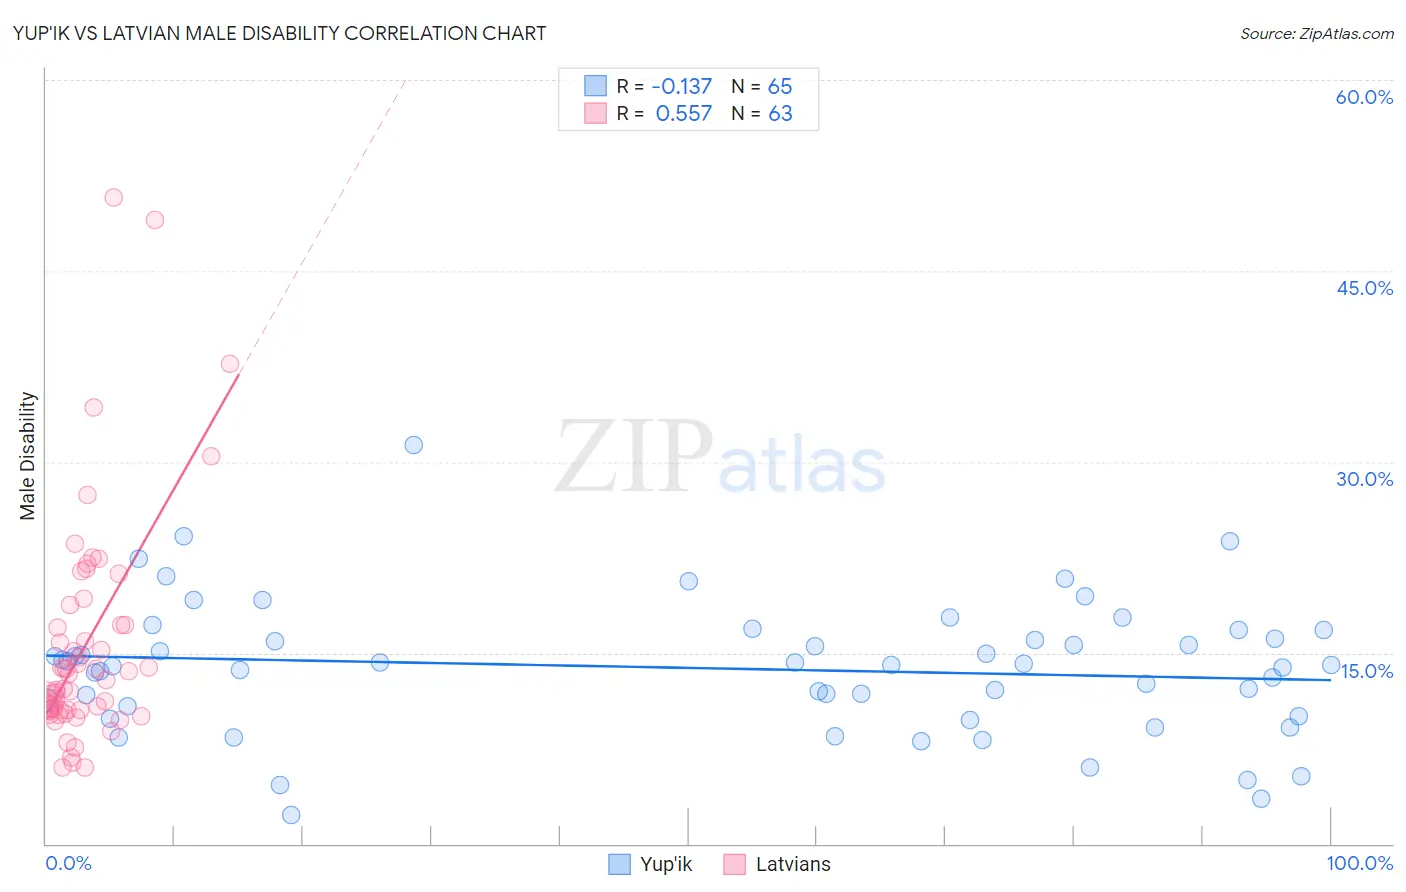
Yup'ik vs Latvian Male Disability Correlation Chart
The statistical analysis conducted on geographies consisting of 39,960,861 people shows a poor negative correlation between the proportion of Yup'ik and percentage of males with a disability in the United States with a correlation coefficient (R) of -0.137 and weighted average of 12.8%. Similarly, the statistical analysis conducted on geographies consisting of 220,715,476 people shows a substantial positive correlation between the proportion of Latvians and percentage of males with a disability in the United States with a correlation coefficient (R) of 0.557 and weighted average of 11.1%, a difference of 15.2%.
Male Disability Correlation Summary
| Measurement | Yup'ik | Latvian |
| Minimum | 2.3% | 6.0% |
| Maximum | 31.3% | 50.8% |
| Range | 29.0% | 44.8% |
| Mean | 13.8% | 15.6% |
| Median | 14.1% | 12.8% |
| Interquartile 25% (IQ1) | 10.4% | 10.5% |
| Interquartile 75% (IQ3) | 16.4% | 17.2% |
| Interquartile Range (IQR) | 6.0% | 6.7% |
| Standard Deviation (Sample) | 5.2% | 9.0% |
| Standard Deviation (Population) | 5.2% | 8.9% |
Similar Demographics by Male Disability
Demographics Similar to Yup'ik by Male Disability
In terms of male disability, the demographic groups most similar to Yup'ik are Cape Verdean (12.8%, a difference of 0.19%), Immigrants from Cabo Verde (12.8%, a difference of 0.19%), Scottish (12.8%, a difference of 0.26%), Spanish (12.7%, a difference of 0.31%), and Welsh (12.7%, a difference of 0.31%).
| Demographics | Rating | Rank | Male Disability |
| Sioux | 0.0 /100 | #281 | Tragic 12.7% |
| Irish | 0.0 /100 | #282 | Tragic 12.7% |
| Germans | 0.0 /100 | #283 | Tragic 12.7% |
| Spanish | 0.0 /100 | #284 | Tragic 12.7% |
| Welsh | 0.0 /100 | #285 | Tragic 12.7% |
| Scottish | 0.0 /100 | #286 | Tragic 12.8% |
| Cape Verdeans | 0.0 /100 | #287 | Tragic 12.8% |
| Yup'ik | 0.0 /100 | #288 | Tragic 12.8% |
| Immigrants | Cabo Verde | 0.0 /100 | #289 | Tragic 12.8% |
| Pima | 0.0 /100 | #290 | Tragic 12.8% |
| Whites/Caucasians | 0.0 /100 | #291 | Tragic 12.8% |
| English | 0.0 /100 | #292 | Tragic 12.8% |
| Yaqui | 0.0 /100 | #293 | Tragic 12.9% |
| Marshallese | 0.0 /100 | #294 | Tragic 12.9% |
| Immigrants | Micronesia | 0.0 /100 | #295 | Tragic 12.9% |
Demographics Similar to Latvians by Male Disability
In terms of male disability, the demographic groups most similar to Latvians are Guatemalan (11.1%, a difference of 0.060%), Immigrants from Western Africa (11.1%, a difference of 0.070%), Russian (11.1%, a difference of 0.11%), Albanian (11.1%, a difference of 0.11%), and Immigrants from West Indies (11.1%, a difference of 0.16%).
| Demographics | Rating | Rank | Male Disability |
| Cubans | 74.9 /100 | #151 | Good 11.0% |
| Immigrants | Albania | 74.4 /100 | #152 | Good 11.0% |
| Immigrants | Northern Europe | 73.2 /100 | #153 | Good 11.1% |
| Immigrants | Moldova | 72.8 /100 | #154 | Good 11.1% |
| Immigrants | Middle Africa | 70.9 /100 | #155 | Good 11.1% |
| Russians | 69.8 /100 | #156 | Good 11.1% |
| Immigrants | Western Africa | 69.2 /100 | #157 | Good 11.1% |
| Latvians | 68.1 /100 | #158 | Good 11.1% |
| Guatemalans | 67.2 /100 | #159 | Good 11.1% |
| Albanians | 66.5 /100 | #160 | Good 11.1% |
| Immigrants | West Indies | 65.7 /100 | #161 | Good 11.1% |
| Immigrants | Haiti | 65.3 /100 | #162 | Good 11.1% |
| Immigrants | Kenya | 63.8 /100 | #163 | Good 11.1% |
| British West Indians | 62.8 /100 | #164 | Good 11.1% |
| Luxembourgers | 61.9 /100 | #165 | Good 11.1% |