Yup'ik vs Immigrants from Ecuador Unemployment Among Ages 30 to 34 years
COMPARE
Yup'ik
Immigrants from Ecuador
Unemployment Among Ages 30 to 34 years
Unemployment Among Ages 30 to 34 years Comparison
Yup'ik
Immigrants from Ecuador
18.5%
UNEMPLOYMENT AMONG AGES 30 TO 34 YEARS
0.0/ 100
METRIC RATING
347th/ 347
METRIC RANK
6.3%
UNEMPLOYMENT AMONG AGES 30 TO 34 YEARS
0.0/ 100
METRIC RATING
277th/ 347
METRIC RANK
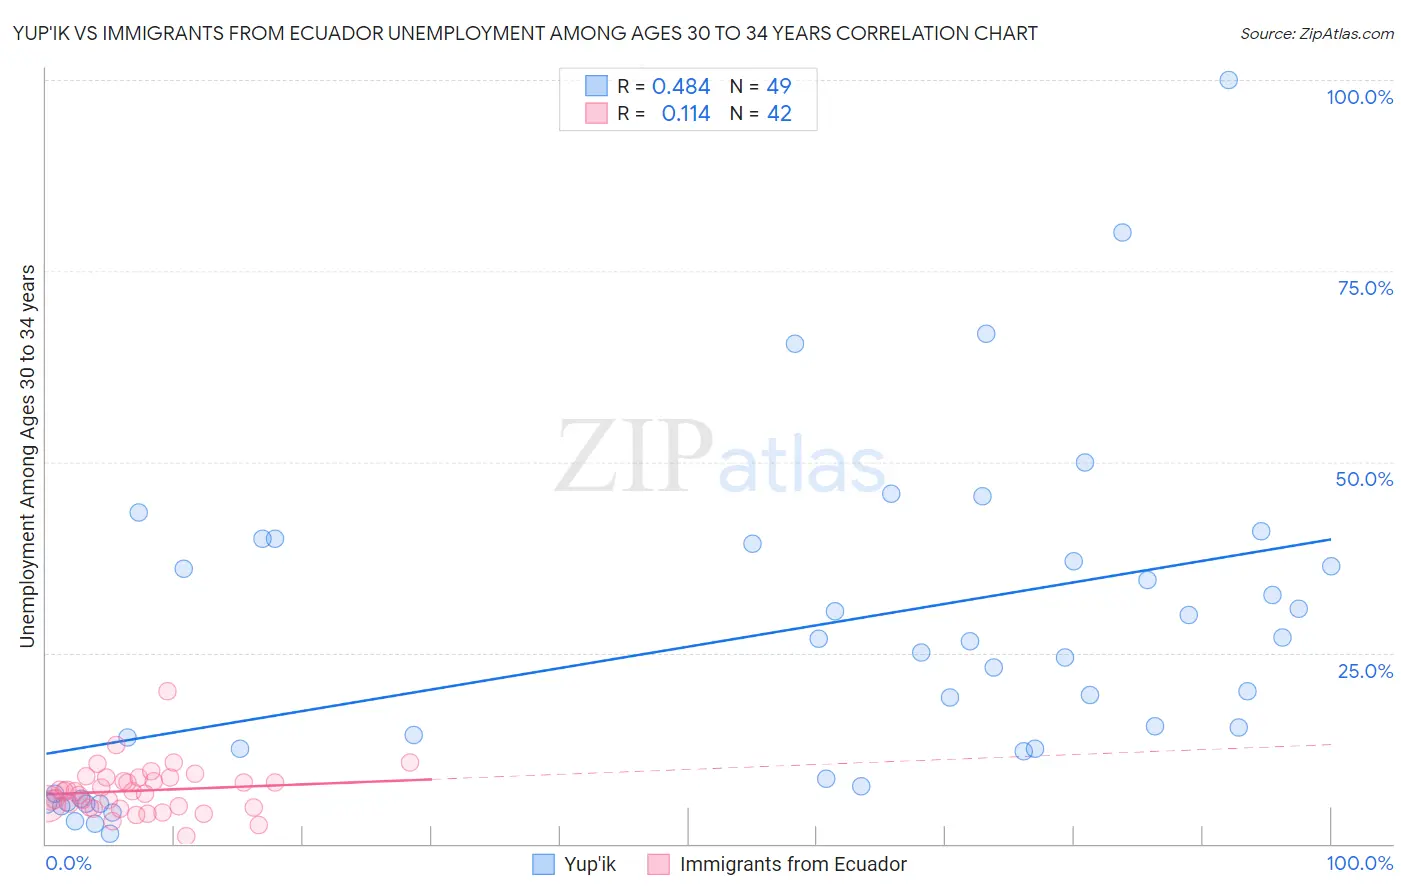
Yup'ik vs Immigrants from Ecuador Unemployment Among Ages 30 to 34 years Correlation Chart
The statistical analysis conducted on geographies consisting of 39,304,366 people shows a moderate positive correlation between the proportion of Yup'ik and unemployment rate among population between the ages 30 and 34 in the United States with a correlation coefficient (R) of 0.484 and weighted average of 18.5%. Similarly, the statistical analysis conducted on geographies consisting of 261,488,885 people shows a poor positive correlation between the proportion of Immigrants from Ecuador and unemployment rate among population between the ages 30 and 34 in the United States with a correlation coefficient (R) of 0.114 and weighted average of 6.3%, a difference of 191.7%.
Unemployment Among Ages 30 to 34 years Correlation Summary
| Measurement | Yup'ik | Immigrants from Ecuador |
| Minimum | 1.3% | 1.0% |
| Maximum | 100.0% | 19.9% |
| Range | 98.7% | 18.9% |
| Mean | 26.5% | 7.0% |
| Median | 24.5% | 6.8% |
| Interquartile 25% (IQ1) | 8.1% | 4.8% |
| Interquartile 75% (IQ3) | 38.1% | 8.6% |
| Interquartile Range (IQR) | 30.1% | 3.8% |
| Standard Deviation (Sample) | 21.2% | 3.2% |
| Standard Deviation (Population) | 20.9% | 3.2% |
Similar Demographics by Unemployment Among Ages 30 to 34 years
Demographics Similar to Yup'ik by Unemployment Among Ages 30 to 34 years
In terms of unemployment among ages 30 to 34 years, the demographic groups most similar to Yup'ik are Tsimshian (13.8%, a difference of 34.2%), Arapaho (12.8%, a difference of 44.1%), Hopi (11.9%, a difference of 54.7%), Inupiat (10.8%, a difference of 70.7%), and Yuman (10.6%, a difference of 74.3%).
| Demographics | Rating | Rank | Unemployment Among Ages 30 to 34 years |
| Pueblo | 0.0 /100 | #333 | Tragic 8.3% |
| Alaska Natives | 0.0 /100 | #334 | Tragic 8.5% |
| Puerto Ricans | 0.0 /100 | #335 | Tragic 8.9% |
| Colville | 0.0 /100 | #336 | Tragic 9.0% |
| Pima | 0.0 /100 | #337 | Tragic 9.6% |
| Yakama | 0.0 /100 | #338 | Tragic 9.8% |
| Tohono O'odham | 0.0 /100 | #339 | Tragic 9.8% |
| Crow | 0.0 /100 | #340 | Tragic 10.3% |
| Navajo | 0.0 /100 | #341 | Tragic 10.6% |
| Yuman | 0.0 /100 | #342 | Tragic 10.6% |
| Inupiat | 0.0 /100 | #343 | Tragic 10.8% |
| Hopi | 0.0 /100 | #344 | Tragic 11.9% |
| Arapaho | 0.0 /100 | #345 | Tragic 12.8% |
| Tsimshian | 0.0 /100 | #346 | Tragic 13.8% |
| Yup'ik | 0.0 /100 | #347 | Tragic 18.5% |
Demographics Similar to Immigrants from Ecuador by Unemployment Among Ages 30 to 34 years
In terms of unemployment among ages 30 to 34 years, the demographic groups most similar to Immigrants from Ecuador are Osage (6.3%, a difference of 0.080%), Cree (6.4%, a difference of 0.56%), Cherokee (6.4%, a difference of 0.61%), Pennsylvania German (6.3%, a difference of 0.73%), and Ecuadorian (6.3%, a difference of 0.79%).
| Demographics | Rating | Rank | Unemployment Among Ages 30 to 34 years |
| Immigrants | Senegal | 0.0 /100 | #270 | Tragic 6.3% |
| Comanche | 0.0 /100 | #271 | Tragic 6.3% |
| Blackfeet | 0.0 /100 | #272 | Tragic 6.3% |
| Ottawa | 0.0 /100 | #273 | Tragic 6.3% |
| U.S. Virgin Islanders | 0.0 /100 | #274 | Tragic 6.3% |
| Ecuadorians | 0.0 /100 | #275 | Tragic 6.3% |
| Pennsylvania Germans | 0.0 /100 | #276 | Tragic 6.3% |
| Immigrants | Ecuador | 0.0 /100 | #277 | Tragic 6.3% |
| Osage | 0.0 /100 | #278 | Tragic 6.3% |
| Cree | 0.0 /100 | #279 | Tragic 6.4% |
| Cherokee | 0.0 /100 | #280 | Tragic 6.4% |
| Immigrants | Caribbean | 0.0 /100 | #281 | Tragic 6.4% |
| Africans | 0.0 /100 | #282 | Tragic 6.4% |
| Hispanics or Latinos | 0.0 /100 | #283 | Tragic 6.4% |
| Immigrants | Bangladesh | 0.0 /100 | #284 | Tragic 6.4% |