Yup'ik vs Immigrants from Ecuador 7th Grade
COMPARE
Yup'ik
Immigrants from Ecuador
7th Grade
7th Grade Comparison
Yup'ik
Immigrants from Ecuador
97.4%
7TH GRADE
100.0/ 100
METRIC RATING
20th/ 347
METRIC RANK
93.7%
7TH GRADE
0.0/ 100
METRIC RATING
318th/ 347
METRIC RANK
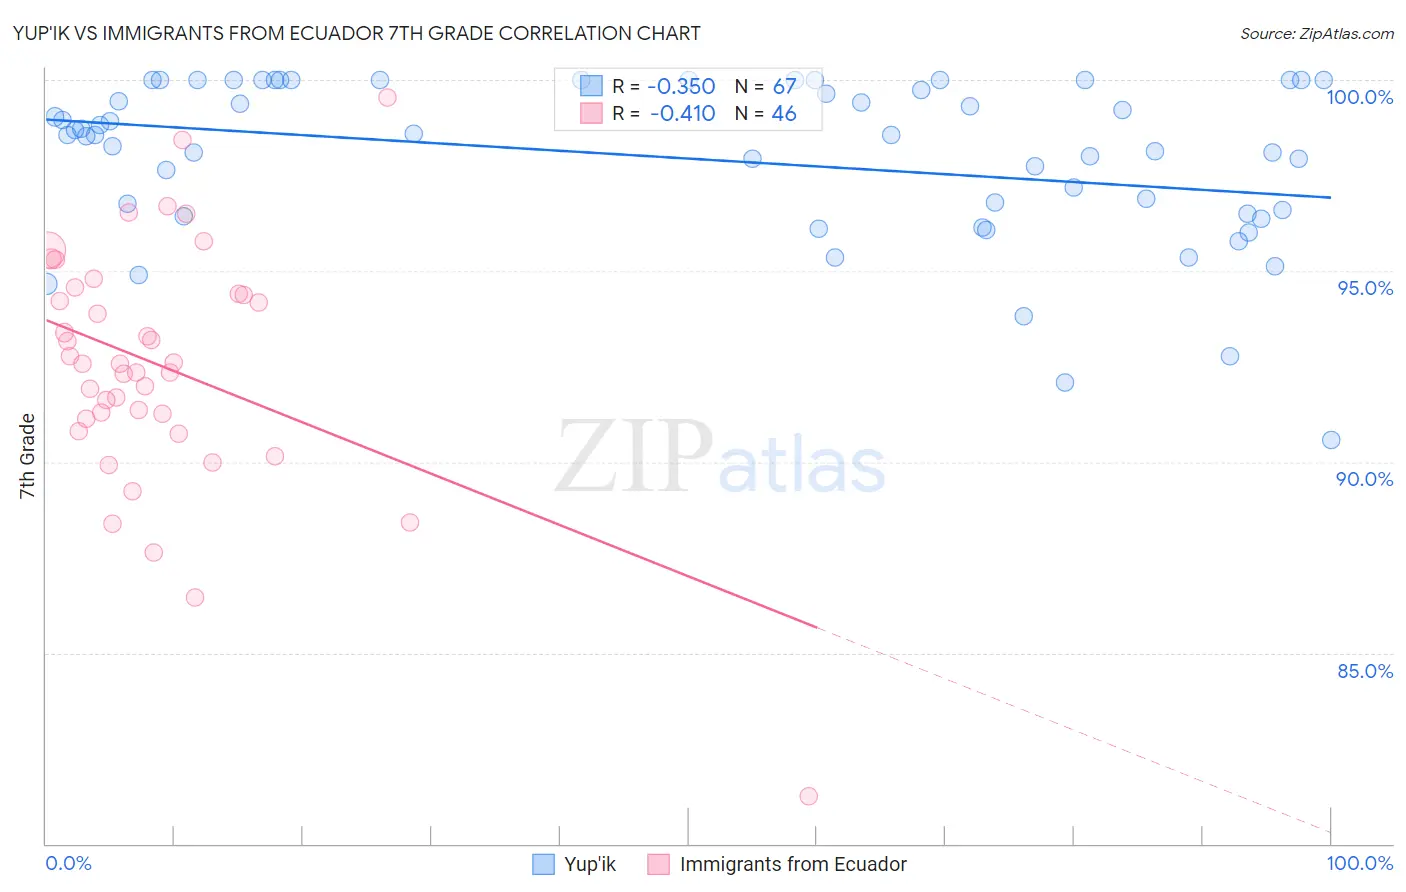
Yup'ik vs Immigrants from Ecuador 7th Grade Correlation Chart
The statistical analysis conducted on geographies consisting of 39,963,824 people shows a mild negative correlation between the proportion of Yup'ik and percentage of population with at least 7th grade education in the United States with a correlation coefficient (R) of -0.350 and weighted average of 97.4%. Similarly, the statistical analysis conducted on geographies consisting of 270,907,929 people shows a moderate negative correlation between the proportion of Immigrants from Ecuador and percentage of population with at least 7th grade education in the United States with a correlation coefficient (R) of -0.410 and weighted average of 93.7%, a difference of 4.0%.
7th Grade Correlation Summary
| Measurement | Yup'ik | Immigrants from Ecuador |
| Minimum | 90.6% | 81.2% |
| Maximum | 100.0% | 99.5% |
| Range | 9.4% | 18.3% |
| Mean | 97.9% | 92.5% |
| Median | 98.6% | 92.6% |
| Interquartile 25% (IQ1) | 96.5% | 91.1% |
| Interquartile 75% (IQ3) | 100.0% | 94.4% |
| Interquartile Range (IQR) | 3.5% | 3.3% |
| Standard Deviation (Sample) | 2.1% | 3.2% |
| Standard Deviation (Population) | 2.1% | 3.2% |
Similar Demographics by 7th Grade
Demographics Similar to Yup'ik by 7th Grade
In terms of 7th grade, the demographic groups most similar to Yup'ik are Inupiat (97.4%, a difference of 0.010%), French Canadian (97.4%, a difference of 0.020%), Croatian (97.4%, a difference of 0.030%), Lithuanian (97.5%, a difference of 0.040%), and Tlingit-Haida (97.5%, a difference of 0.050%).
| Demographics | Rating | Rank | 7th Grade |
| Swedes | 100.0 /100 | #13 | Exceptional 97.6% |
| Pennsylvania Germans | 100.0 /100 | #14 | Exceptional 97.6% |
| English | 100.0 /100 | #15 | Exceptional 97.6% |
| Irish | 100.0 /100 | #16 | Exceptional 97.5% |
| Scottish | 100.0 /100 | #17 | Exceptional 97.5% |
| Tlingit-Haida | 100.0 /100 | #18 | Exceptional 97.5% |
| Lithuanians | 100.0 /100 | #19 | Exceptional 97.5% |
| Yup'ik | 100.0 /100 | #20 | Exceptional 97.4% |
| Inupiat | 100.0 /100 | #21 | Exceptional 97.4% |
| French Canadians | 100.0 /100 | #22 | Exceptional 97.4% |
| Croatians | 100.0 /100 | #23 | Exceptional 97.4% |
| Welsh | 100.0 /100 | #24 | Exceptional 97.4% |
| French | 100.0 /100 | #25 | Exceptional 97.4% |
| Scotch-Irish | 100.0 /100 | #26 | Exceptional 97.4% |
| Danes | 100.0 /100 | #27 | Exceptional 97.4% |
Demographics Similar to Immigrants from Ecuador by 7th Grade
In terms of 7th grade, the demographic groups most similar to Immigrants from Ecuador are Immigrants from Cambodia (93.7%, a difference of 0.030%), Immigrants from Cuba (93.8%, a difference of 0.080%), Immigrants from Vietnam (93.9%, a difference of 0.16%), Vietnamese (93.9%, a difference of 0.19%), and Immigrants from Fiji (93.5%, a difference of 0.21%).
| Demographics | Rating | Rank | 7th Grade |
| Puerto Ricans | 0.0 /100 | #311 | Tragic 94.0% |
| Immigrants | Immigrants | 0.0 /100 | #312 | Tragic 94.0% |
| Immigrants | Bangladesh | 0.0 /100 | #313 | Tragic 94.0% |
| Japanese | 0.0 /100 | #314 | Tragic 94.0% |
| Vietnamese | 0.0 /100 | #315 | Tragic 93.9% |
| Immigrants | Vietnam | 0.0 /100 | #316 | Tragic 93.9% |
| Immigrants | Cuba | 0.0 /100 | #317 | Tragic 93.8% |
| Immigrants | Ecuador | 0.0 /100 | #318 | Tragic 93.7% |
| Immigrants | Cambodia | 0.0 /100 | #319 | Tragic 93.7% |
| Immigrants | Fiji | 0.0 /100 | #320 | Tragic 93.5% |
| Belizeans | 0.0 /100 | #321 | Tragic 93.5% |
| Nicaraguans | 0.0 /100 | #322 | Tragic 93.5% |
| Immigrants | Belize | 0.0 /100 | #323 | Tragic 93.4% |
| Dominicans | 0.0 /100 | #324 | Tragic 93.3% |
| Central American Indians | 0.0 /100 | #325 | Tragic 93.3% |