Yup'ik vs Immigrants from Ecuador Female Poverty Among 25-34 Year Olds
COMPARE
Yup'ik
Immigrants from Ecuador
Female Poverty Among 25-34 Year Olds
Female Poverty Among 25-34 Year Olds Comparison
Yup'ik
Immigrants from Ecuador
24.3%
FEMALE POVERTY AMONG 25-34 YEAR OLDS
0.0/ 100
METRIC RATING
343rd/ 347
METRIC RANK
14.6%
FEMALE POVERTY AMONG 25-34 YEAR OLDS
1.9/ 100
METRIC RATING
232nd/ 347
METRIC RANK
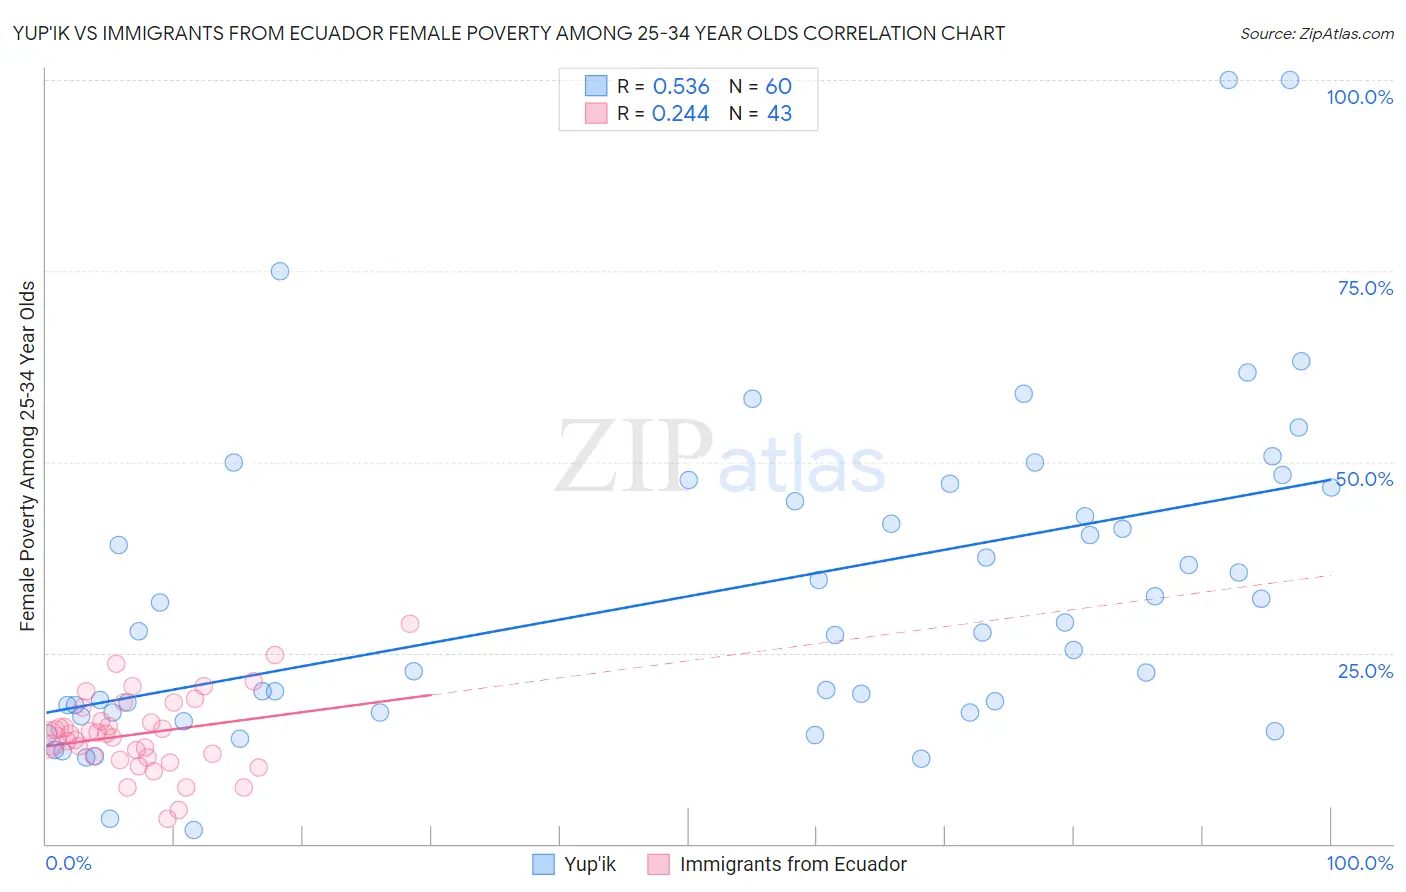
Yup'ik vs Immigrants from Ecuador Female Poverty Among 25-34 Year Olds Correlation Chart
The statistical analysis conducted on geographies consisting of 39,877,637 people shows a substantial positive correlation between the proportion of Yup'ik and poverty level among females between the ages 25 and 34 in the United States with a correlation coefficient (R) of 0.536 and weighted average of 24.3%. Similarly, the statistical analysis conducted on geographies consisting of 268,011,049 people shows a weak positive correlation between the proportion of Immigrants from Ecuador and poverty level among females between the ages 25 and 34 in the United States with a correlation coefficient (R) of 0.244 and weighted average of 14.6%, a difference of 66.1%.
Female Poverty Among 25-34 Year Olds Correlation Summary
| Measurement | Yup'ik | Immigrants from Ecuador |
| Minimum | 1.7% | 3.2% |
| Maximum | 100.0% | 28.8% |
| Range | 98.3% | 25.6% |
| Mean | 32.7% | 14.4% |
| Median | 27.7% | 14.3% |
| Interquartile 25% (IQ1) | 17.2% | 11.3% |
| Interquartile 75% (IQ3) | 45.7% | 17.9% |
| Interquartile Range (IQR) | 28.6% | 6.5% |
| Standard Deviation (Sample) | 20.8% | 5.2% |
| Standard Deviation (Population) | 20.6% | 5.1% |
Similar Demographics by Female Poverty Among 25-34 Year Olds
Demographics Similar to Yup'ik by Female Poverty Among 25-34 Year Olds
In terms of female poverty among 25-34 year olds, the demographic groups most similar to Yup'ik are Tohono O'odham (24.7%, a difference of 1.8%), Hopi (23.7%, a difference of 2.7%), Pima (25.3%, a difference of 4.1%), Navajo (23.3%, a difference of 4.1%), and Sioux (23.0%, a difference of 5.9%).
| Demographics | Rating | Rank | Female Poverty Among 25-34 Year Olds |
| Cajuns | 0.0 /100 | #333 | Tragic 19.9% |
| Apache | 0.0 /100 | #334 | Tragic 20.1% |
| Natives/Alaskans | 0.0 /100 | #335 | Tragic 20.3% |
| Pueblo | 0.0 /100 | #336 | Tragic 22.2% |
| Crow | 0.0 /100 | #337 | Tragic 22.7% |
| Houma | 0.0 /100 | #338 | Tragic 22.7% |
| Yuman | 0.0 /100 | #339 | Tragic 22.9% |
| Sioux | 0.0 /100 | #340 | Tragic 23.0% |
| Navajo | 0.0 /100 | #341 | Tragic 23.3% |
| Hopi | 0.0 /100 | #342 | Tragic 23.7% |
| Yup'ik | 0.0 /100 | #343 | Tragic 24.3% |
| Tohono O'odham | 0.0 /100 | #344 | Tragic 24.7% |
| Pima | 0.0 /100 | #345 | Tragic 25.3% |
| Lumbee | 0.0 /100 | #346 | Tragic 26.3% |
| Puerto Ricans | 0.0 /100 | #347 | Tragic 26.3% |
Demographics Similar to Immigrants from Ecuador by Female Poverty Among 25-34 Year Olds
In terms of female poverty among 25-34 year olds, the demographic groups most similar to Immigrants from Ecuador are White/Caucasian (14.7%, a difference of 0.18%), Delaware (14.6%, a difference of 0.31%), Spaniard (14.6%, a difference of 0.36%), Cuban (14.7%, a difference of 0.41%), and Spanish (14.6%, a difference of 0.49%).
| Demographics | Rating | Rank | Female Poverty Among 25-34 Year Olds |
| Immigrants | Barbados | 3.4 /100 | #225 | Tragic 14.5% |
| Nicaraguans | 3.3 /100 | #226 | Tragic 14.5% |
| Celtics | 2.8 /100 | #227 | Tragic 14.5% |
| Vietnamese | 2.6 /100 | #228 | Tragic 14.6% |
| Spanish | 2.5 /100 | #229 | Tragic 14.6% |
| Spaniards | 2.3 /100 | #230 | Tragic 14.6% |
| Delaware | 2.3 /100 | #231 | Tragic 14.6% |
| Immigrants | Ecuador | 1.9 /100 | #232 | Tragic 14.6% |
| Whites/Caucasians | 1.8 /100 | #233 | Tragic 14.7% |
| Cubans | 1.6 /100 | #234 | Tragic 14.7% |
| Immigrants | Jamaica | 1.4 /100 | #235 | Tragic 14.7% |
| Salvadorans | 1.4 /100 | #236 | Tragic 14.7% |
| Immigrants | Ghana | 1.4 /100 | #237 | Tragic 14.7% |
| Alsatians | 1.4 /100 | #238 | Tragic 14.7% |
| Malaysians | 1.4 /100 | #239 | Tragic 14.7% |