Yup'ik vs Immigrants from Honduras Male Disability
COMPARE
Yup'ik
Immigrants from Honduras
Male Disability
Male Disability Comparison
Yup'ik
Immigrants from Honduras
12.8%
MALE DISABILITY
0.0/ 100
METRIC RATING
288th/ 347
METRIC RANK
11.2%
MALE DISABILITY
48.7/ 100
METRIC RATING
175th/ 347
METRIC RANK
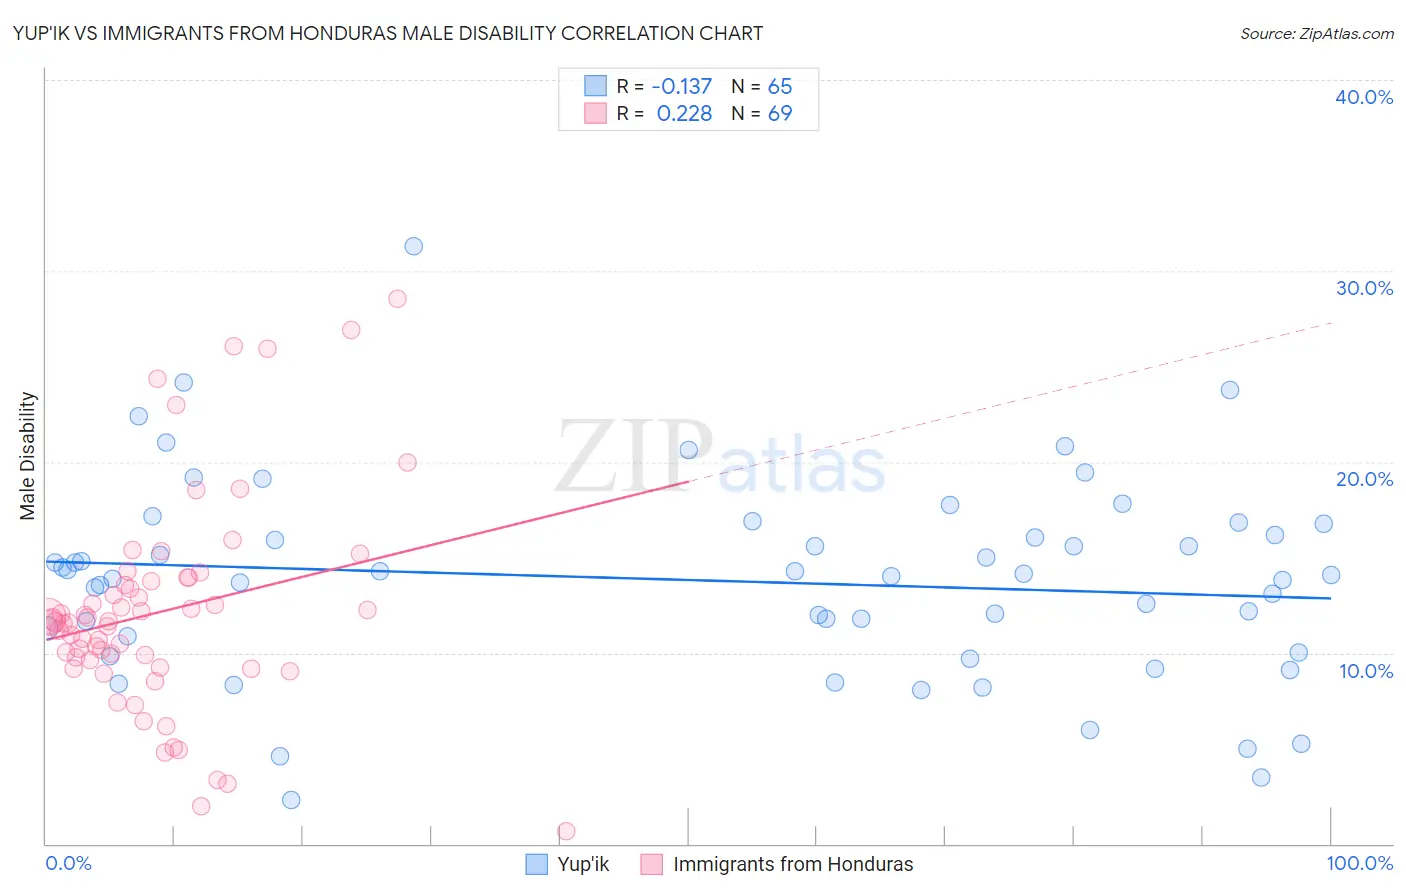
Yup'ik vs Immigrants from Honduras Male Disability Correlation Chart
The statistical analysis conducted on geographies consisting of 39,960,861 people shows a poor negative correlation between the proportion of Yup'ik and percentage of males with a disability in the United States with a correlation coefficient (R) of -0.137 and weighted average of 12.8%. Similarly, the statistical analysis conducted on geographies consisting of 322,552,895 people shows a weak positive correlation between the proportion of Immigrants from Honduras and percentage of males with a disability in the United States with a correlation coefficient (R) of 0.228 and weighted average of 11.2%, a difference of 13.9%.
Male Disability Correlation Summary
| Measurement | Yup'ik | Immigrants from Honduras |
| Minimum | 2.3% | 0.65% |
| Maximum | 31.3% | 28.6% |
| Range | 29.0% | 27.9% |
| Mean | 13.8% | 12.2% |
| Median | 14.1% | 11.6% |
| Interquartile 25% (IQ1) | 10.4% | 9.4% |
| Interquartile 75% (IQ3) | 16.4% | 13.8% |
| Interquartile Range (IQR) | 6.0% | 4.4% |
| Standard Deviation (Sample) | 5.2% | 5.6% |
| Standard Deviation (Population) | 5.2% | 5.5% |
Similar Demographics by Male Disability
Demographics Similar to Yup'ik by Male Disability
In terms of male disability, the demographic groups most similar to Yup'ik are Cape Verdean (12.8%, a difference of 0.19%), Immigrants from Cabo Verde (12.8%, a difference of 0.19%), Scottish (12.8%, a difference of 0.26%), Spanish (12.7%, a difference of 0.31%), and Welsh (12.7%, a difference of 0.31%).
| Demographics | Rating | Rank | Male Disability |
| Sioux | 0.0 /100 | #281 | Tragic 12.7% |
| Irish | 0.0 /100 | #282 | Tragic 12.7% |
| Germans | 0.0 /100 | #283 | Tragic 12.7% |
| Spanish | 0.0 /100 | #284 | Tragic 12.7% |
| Welsh | 0.0 /100 | #285 | Tragic 12.7% |
| Scottish | 0.0 /100 | #286 | Tragic 12.8% |
| Cape Verdeans | 0.0 /100 | #287 | Tragic 12.8% |
| Yup'ik | 0.0 /100 | #288 | Tragic 12.8% |
| Immigrants | Cabo Verde | 0.0 /100 | #289 | Tragic 12.8% |
| Pima | 0.0 /100 | #290 | Tragic 12.8% |
| Whites/Caucasians | 0.0 /100 | #291 | Tragic 12.8% |
| English | 0.0 /100 | #292 | Tragic 12.8% |
| Yaqui | 0.0 /100 | #293 | Tragic 12.9% |
| Marshallese | 0.0 /100 | #294 | Tragic 12.9% |
| Immigrants | Micronesia | 0.0 /100 | #295 | Tragic 12.9% |
Demographics Similar to Immigrants from Honduras by Male Disability
In terms of male disability, the demographic groups most similar to Immigrants from Honduras are Maltese (11.2%, a difference of 0.070%), Immigrants from Burma/Myanmar (11.2%, a difference of 0.10%), Romanian (11.2%, a difference of 0.12%), Syrian (11.2%, a difference of 0.12%), and Haitian (11.2%, a difference of 0.21%).
| Demographics | Rating | Rank | Male Disability |
| Immigrants | Latin America | 54.0 /100 | #168 | Average 11.2% |
| Barbadians | 53.4 /100 | #169 | Average 11.2% |
| New Zealanders | 52.9 /100 | #170 | Average 11.2% |
| Haitians | 52.5 /100 | #171 | Average 11.2% |
| Romanians | 50.7 /100 | #172 | Average 11.2% |
| Immigrants | Burma/Myanmar | 50.4 /100 | #173 | Average 11.2% |
| Maltese | 50.0 /100 | #174 | Average 11.2% |
| Immigrants | Honduras | 48.7 /100 | #175 | Average 11.2% |
| Syrians | 46.6 /100 | #176 | Average 11.2% |
| Immigrants | Norway | 44.2 /100 | #177 | Average 11.3% |
| Australians | 42.2 /100 | #178 | Average 11.3% |
| Immigrants | Caribbean | 41.4 /100 | #179 | Average 11.3% |
| Hondurans | 41.1 /100 | #180 | Average 11.3% |
| Immigrants | Senegal | 34.4 /100 | #181 | Fair 11.3% |
| Immigrants | Belize | 33.7 /100 | #182 | Fair 11.3% |