Yugoslavian vs Immigrants from Czechoslovakia Self-Care Disability
COMPARE
Yugoslavian
Immigrants from Czechoslovakia
Self-Care Disability
Self-Care Disability Comparison
Yugoslavians
Immigrants from Czechoslovakia
2.5%
SELF-CARE DISABILITY
36.1/ 100
METRIC RATING
184th/ 347
METRIC RANK
2.4%
SELF-CARE DISABILITY
97.7/ 100
METRIC RATING
90th/ 347
METRIC RANK
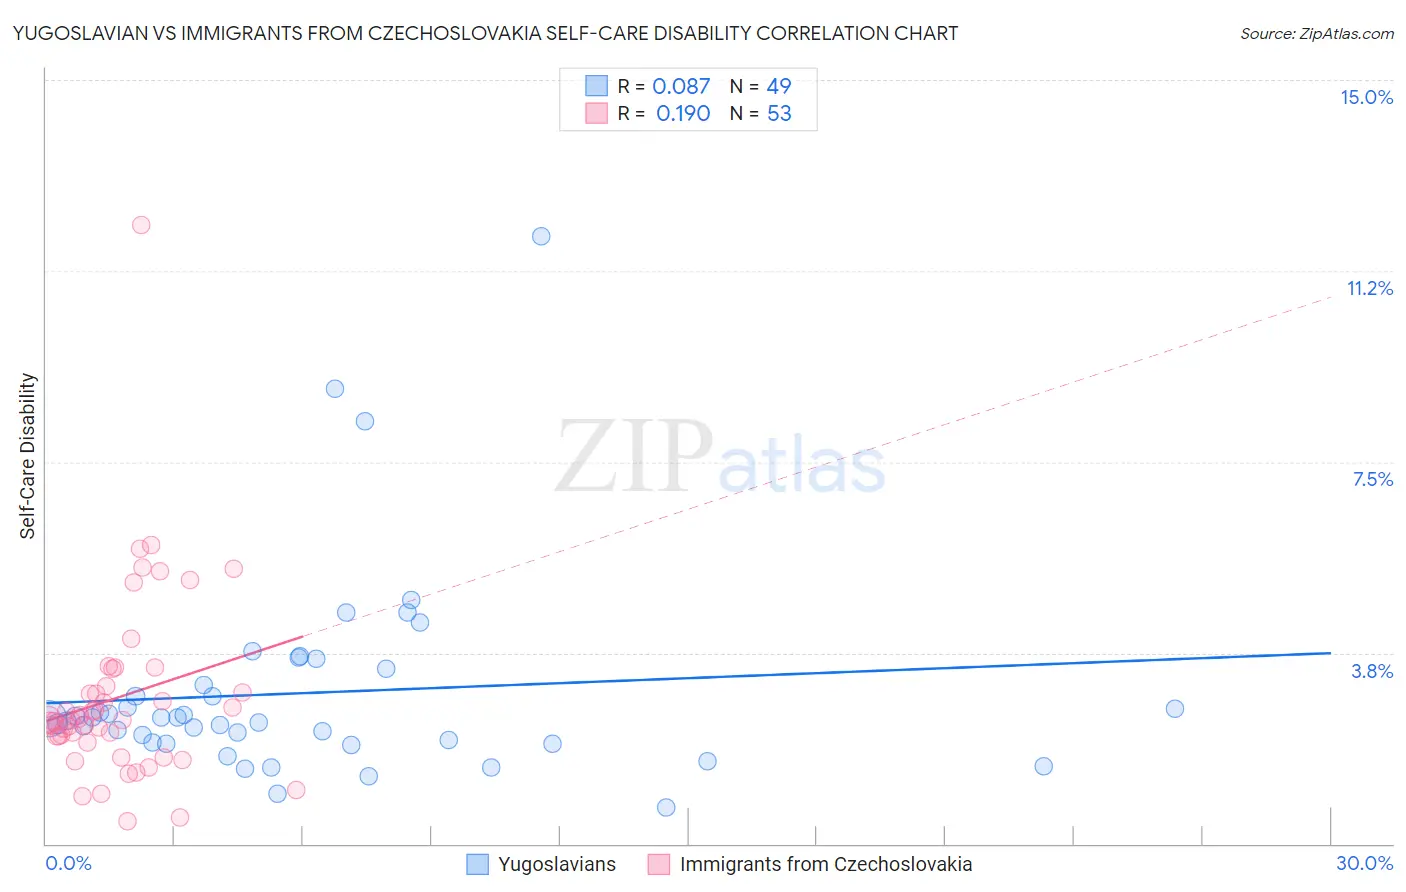
Yugoslavian vs Immigrants from Czechoslovakia Self-Care Disability Correlation Chart
The statistical analysis conducted on geographies consisting of 285,516,060 people shows a slight positive correlation between the proportion of Yugoslavians and percentage of population with self-care disability in the United States with a correlation coefficient (R) of 0.087 and weighted average of 2.5%. Similarly, the statistical analysis conducted on geographies consisting of 195,412,525 people shows a poor positive correlation between the proportion of Immigrants from Czechoslovakia and percentage of population with self-care disability in the United States with a correlation coefficient (R) of 0.190 and weighted average of 2.4%, a difference of 5.4%.
Self-Care Disability Correlation Summary
| Measurement | Yugoslavian | Immigrants from Czechoslovakia |
| Minimum | 0.70% | 0.44% |
| Maximum | 11.9% | 12.1% |
| Range | 11.2% | 11.7% |
| Mean | 3.0% | 2.9% |
| Median | 2.5% | 2.4% |
| Interquartile 25% (IQ1) | 2.0% | 2.0% |
| Interquartile 75% (IQ3) | 3.3% | 3.3% |
| Interquartile Range (IQR) | 1.3% | 1.2% |
| Standard Deviation (Sample) | 2.0% | 1.8% |
| Standard Deviation (Population) | 2.0% | 1.8% |
Similar Demographics by Self-Care Disability
Demographics Similar to Yugoslavians by Self-Care Disability
In terms of self-care disability, the demographic groups most similar to Yugoslavians are Salvadoran (2.5%, a difference of 0.020%), Maltese (2.5%, a difference of 0.070%), Slavic (2.5%, a difference of 0.090%), Immigrants from El Salvador (2.5%, a difference of 0.17%), and Ghanaian (2.5%, a difference of 0.21%).
| Demographics | Rating | Rank | Self-Care Disability |
| Immigrants | Kazakhstan | 46.7 /100 | #177 | Average 2.5% |
| English | 46.2 /100 | #178 | Average 2.5% |
| Hungarians | 45.5 /100 | #179 | Average 2.5% |
| Indonesians | 41.2 /100 | #180 | Average 2.5% |
| Ghanaians | 40.4 /100 | #181 | Average 2.5% |
| Maltese | 37.5 /100 | #182 | Fair 2.5% |
| Salvadorans | 36.4 /100 | #183 | Fair 2.5% |
| Yugoslavians | 36.1 /100 | #184 | Fair 2.5% |
| Slavs | 34.3 /100 | #185 | Fair 2.5% |
| Immigrants | El Salvador | 33.0 /100 | #186 | Fair 2.5% |
| Irish | 28.7 /100 | #187 | Fair 2.5% |
| Immigrants | Oceania | 28.3 /100 | #188 | Fair 2.5% |
| Immigrants | Eastern Europe | 28.0 /100 | #189 | Fair 2.5% |
| Sioux | 24.6 /100 | #190 | Fair 2.5% |
| Moroccans | 22.9 /100 | #191 | Fair 2.5% |
Demographics Similar to Immigrants from Czechoslovakia by Self-Care Disability
In terms of self-care disability, the demographic groups most similar to Immigrants from Czechoslovakia are Immigrants from Jordan (2.4%, a difference of 0.010%), Immigrants from Congo (2.4%, a difference of 0.14%), Icelander (2.4%, a difference of 0.15%), Sierra Leonean (2.4%, a difference of 0.19%), and Lithuanian (2.4%, a difference of 0.19%).
| Demographics | Rating | Rank | Self-Care Disability |
| Indians (Asian) | 98.7 /100 | #83 | Exceptional 2.3% |
| Immigrants | Spain | 98.7 /100 | #84 | Exceptional 2.3% |
| Estonians | 98.3 /100 | #85 | Exceptional 2.3% |
| Immigrants | Northern Africa | 98.2 /100 | #86 | Exceptional 2.3% |
| Sierra Leoneans | 98.0 /100 | #87 | Exceptional 2.4% |
| Lithuanians | 98.0 /100 | #88 | Exceptional 2.4% |
| Immigrants | Congo | 98.0 /100 | #89 | Exceptional 2.4% |
| Immigrants | Czechoslovakia | 97.7 /100 | #90 | Exceptional 2.4% |
| Immigrants | Jordan | 97.7 /100 | #91 | Exceptional 2.4% |
| Icelanders | 97.4 /100 | #92 | Exceptional 2.4% |
| Immigrants | Latvia | 97.0 /100 | #93 | Exceptional 2.4% |
| Macedonians | 96.9 /100 | #94 | Exceptional 2.4% |
| Immigrants | Asia | 96.9 /100 | #95 | Exceptional 2.4% |
| Immigrants | Chile | 96.7 /100 | #96 | Exceptional 2.4% |
| Swiss | 96.6 /100 | #97 | Exceptional 2.4% |