Immigrants from Saudi Arabia vs Immigrants from Moldova Ambulatory Disability
COMPARE
Immigrants from Saudi Arabia
Immigrants from Moldova
Ambulatory Disability
Ambulatory Disability Comparison
Immigrants from Saudi Arabia
Immigrants from Moldova
5.4%
AMBULATORY DISABILITY
100.0/ 100
METRIC RATING
24th/ 347
METRIC RANK
6.0%
AMBULATORY DISABILITY
82.4/ 100
METRIC RATING
147th/ 347
METRIC RANK
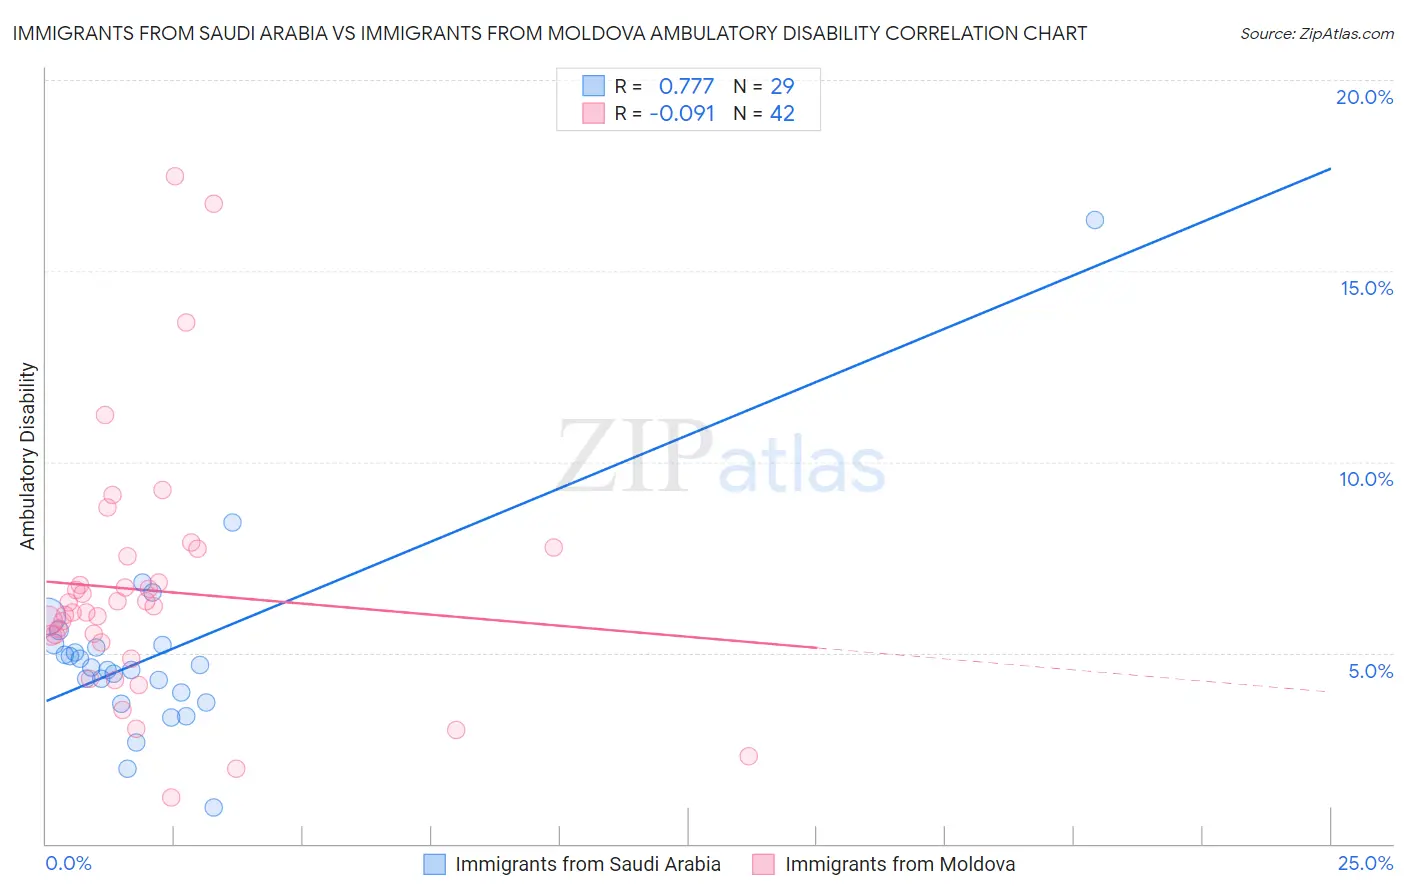
Immigrants from Saudi Arabia vs Immigrants from Moldova Ambulatory Disability Correlation Chart
The statistical analysis conducted on geographies consisting of 164,275,583 people shows a strong positive correlation between the proportion of Immigrants from Saudi Arabia and percentage of population with ambulatory disability in the United States with a correlation coefficient (R) of 0.777 and weighted average of 5.4%. Similarly, the statistical analysis conducted on geographies consisting of 124,381,325 people shows a slight negative correlation between the proportion of Immigrants from Moldova and percentage of population with ambulatory disability in the United States with a correlation coefficient (R) of -0.091 and weighted average of 6.0%, a difference of 11.2%.
Ambulatory Disability Correlation Summary
| Measurement | Immigrants from Saudi Arabia | Immigrants from Moldova |
| Minimum | 0.94% | 1.2% |
| Maximum | 16.3% | 17.5% |
| Range | 15.4% | 16.3% |
| Mean | 5.0% | 6.6% |
| Median | 4.6% | 6.1% |
| Interquartile 25% (IQ1) | 3.8% | 5.3% |
| Interquartile 75% (IQ3) | 5.2% | 7.5% |
| Interquartile Range (IQR) | 1.4% | 2.2% |
| Standard Deviation (Sample) | 2.6% | 3.3% |
| Standard Deviation (Population) | 2.6% | 3.3% |
Similar Demographics by Ambulatory Disability
Demographics Similar to Immigrants from Saudi Arabia by Ambulatory Disability
In terms of ambulatory disability, the demographic groups most similar to Immigrants from Saudi Arabia are Zimbabwean (5.4%, a difference of 0.080%), Tongan (5.4%, a difference of 0.090%), Immigrants from Nepal (5.4%, a difference of 0.11%), Immigrants from Israel (5.4%, a difference of 0.13%), and Asian (5.4%, a difference of 0.27%).
| Demographics | Rating | Rank | Ambulatory Disability |
| Immigrants | Ethiopia | 100.0 /100 | #17 | Exceptional 5.4% |
| Immigrants | Sri Lanka | 100.0 /100 | #18 | Exceptional 5.4% |
| Indians (Asian) | 100.0 /100 | #19 | Exceptional 5.4% |
| Ethiopians | 100.0 /100 | #20 | Exceptional 5.4% |
| Immigrants | Kuwait | 100.0 /100 | #21 | Exceptional 5.4% |
| Immigrants | Israel | 100.0 /100 | #22 | Exceptional 5.4% |
| Tongans | 100.0 /100 | #23 | Exceptional 5.4% |
| Immigrants | Saudi Arabia | 100.0 /100 | #24 | Exceptional 5.4% |
| Zimbabweans | 100.0 /100 | #25 | Exceptional 5.4% |
| Immigrants | Nepal | 100.0 /100 | #26 | Exceptional 5.4% |
| Asians | 100.0 /100 | #27 | Exceptional 5.4% |
| Cambodians | 100.0 /100 | #28 | Exceptional 5.4% |
| Immigrants | Iran | 100.0 /100 | #29 | Exceptional 5.4% |
| Immigrants | Turkey | 100.0 /100 | #30 | Exceptional 5.4% |
| Immigrants | Venezuela | 100.0 /100 | #31 | Exceptional 5.4% |
Demographics Similar to Immigrants from Moldova by Ambulatory Disability
In terms of ambulatory disability, the demographic groups most similar to Immigrants from Moldova are Pakistani (6.0%, a difference of 0.010%), Immigrants from Greece (6.0%, a difference of 0.010%), Macedonian (6.0%, a difference of 0.040%), Immigrants from Eastern Europe (6.0%, a difference of 0.040%), and Romanian (6.0%, a difference of 0.050%).
| Demographics | Rating | Rank | Ambulatory Disability |
| Czechs | 83.3 /100 | #140 | Excellent 6.0% |
| Swedes | 83.1 /100 | #141 | Excellent 6.0% |
| Immigrants | Philippines | 83.0 /100 | #142 | Excellent 6.0% |
| Romanians | 82.9 /100 | #143 | Excellent 6.0% |
| Macedonians | 82.8 /100 | #144 | Excellent 6.0% |
| Pakistanis | 82.5 /100 | #145 | Excellent 6.0% |
| Immigrants | Greece | 82.5 /100 | #146 | Excellent 6.0% |
| Immigrants | Moldova | 82.4 /100 | #147 | Excellent 6.0% |
| Immigrants | Eastern Europe | 82.0 /100 | #148 | Excellent 6.0% |
| Lithuanians | 81.9 /100 | #149 | Excellent 6.0% |
| Maltese | 81.6 /100 | #150 | Excellent 6.0% |
| Greeks | 79.6 /100 | #151 | Good 6.0% |
| Immigrants | Austria | 78.8 /100 | #152 | Good 6.0% |
| Syrians | 75.5 /100 | #153 | Good 6.0% |
| Immigrants | Croatia | 75.1 /100 | #154 | Good 6.0% |