Yugoslavian vs Immigrants from Egypt In Labor Force | Age 16-19
COMPARE
Yugoslavian
Immigrants from Egypt
In Labor Force | Age 16-19
In Labor Force | Age 16-19 Comparison
Yugoslavians
Immigrants from Egypt
41.8%
IN LABOR FORCE | AGE 16-19
100.0/ 100
METRIC RATING
35th/ 347
METRIC RANK
34.6%
IN LABOR FORCE | AGE 16-19
1.2/ 100
METRIC RATING
257th/ 347
METRIC RANK
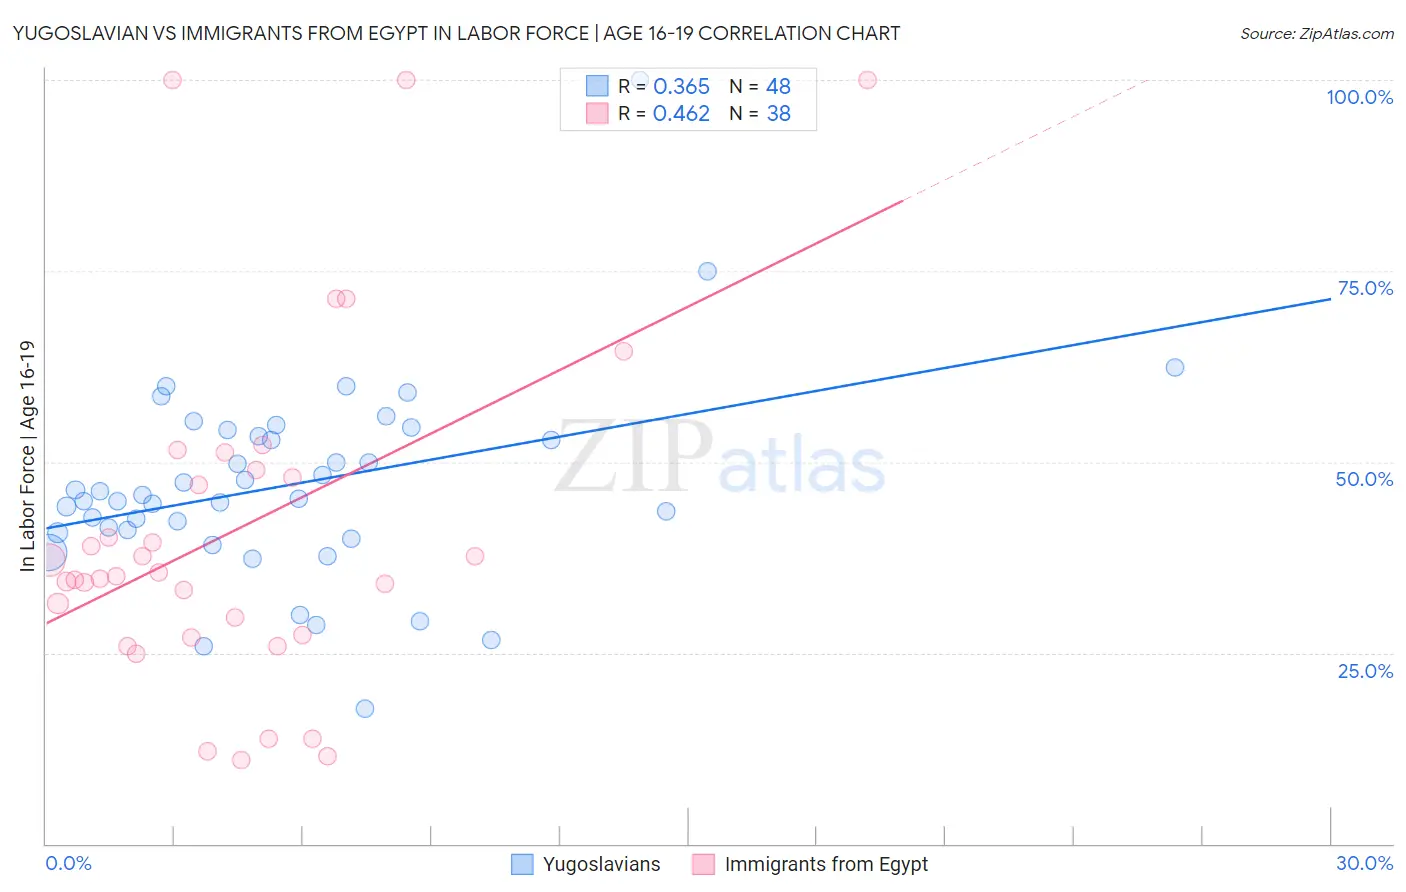
Yugoslavian vs Immigrants from Egypt In Labor Force | Age 16-19 Correlation Chart
The statistical analysis conducted on geographies consisting of 285,420,048 people shows a mild positive correlation between the proportion of Yugoslavians and labor force participation rate among population between the ages 16 and 19 in the United States with a correlation coefficient (R) of 0.365 and weighted average of 41.8%. Similarly, the statistical analysis conducted on geographies consisting of 245,278,440 people shows a moderate positive correlation between the proportion of Immigrants from Egypt and labor force participation rate among population between the ages 16 and 19 in the United States with a correlation coefficient (R) of 0.462 and weighted average of 34.6%, a difference of 20.9%.
In Labor Force | Age 16-19 Correlation Summary
| Measurement | Yugoslavian | Immigrants from Egypt |
| Minimum | 17.7% | 11.0% |
| Maximum | 100.0% | 100.0% |
| Range | 82.3% | 89.0% |
| Mean | 46.9% | 41.2% |
| Median | 45.4% | 35.3% |
| Interquartile 25% (IQ1) | 40.9% | 27.4% |
| Interquartile 75% (IQ3) | 53.8% | 48.9% |
| Interquartile Range (IQR) | 12.9% | 21.5% |
| Standard Deviation (Sample) | 13.2% | 22.7% |
| Standard Deviation (Population) | 13.0% | 22.4% |
Similar Demographics by In Labor Force | Age 16-19
Demographics Similar to Yugoslavians by In Labor Force | Age 16-19
In terms of in labor force | age 16-19, the demographic groups most similar to Yugoslavians are Immigrants from Bosnia and Herzegovina (41.8%, a difference of 0.020%), Liberian (41.8%, a difference of 0.10%), Immigrants from the Azores (41.7%, a difference of 0.14%), Immigrants from Congo (41.7%, a difference of 0.22%), and Czechoslovakian (41.9%, a difference of 0.24%).
| Demographics | Rating | Rank | In Labor Force | Age 16-19 |
| Poles | 100.0 /100 | #28 | Exceptional 42.1% |
| French | 100.0 /100 | #29 | Exceptional 42.1% |
| Scottish | 100.0 /100 | #30 | Exceptional 42.0% |
| Irish | 100.0 /100 | #31 | Exceptional 42.0% |
| Czechoslovakians | 100.0 /100 | #32 | Exceptional 41.9% |
| Liberians | 100.0 /100 | #33 | Exceptional 41.8% |
| Immigrants | Bosnia and Herzegovina | 100.0 /100 | #34 | Exceptional 41.8% |
| Yugoslavians | 100.0 /100 | #35 | Exceptional 41.8% |
| Immigrants | Azores | 100.0 /100 | #36 | Exceptional 41.7% |
| Immigrants | Congo | 100.0 /100 | #37 | Exceptional 41.7% |
| Sioux | 100.0 /100 | #38 | Exceptional 41.5% |
| Scotch-Irish | 100.0 /100 | #39 | Exceptional 41.5% |
| Immigrants | Liberia | 100.0 /100 | #40 | Exceptional 41.5% |
| Celtics | 100.0 /100 | #41 | Exceptional 41.3% |
| Whites/Caucasians | 100.0 /100 | #42 | Exceptional 41.3% |
Demographics Similar to Immigrants from Egypt by In Labor Force | Age 16-19
In terms of in labor force | age 16-19, the demographic groups most similar to Immigrants from Egypt are Immigrants from South Central Asia (34.6%, a difference of 0.010%), Thai (34.6%, a difference of 0.010%), Immigrants (34.6%, a difference of 0.020%), Egyptian (34.5%, a difference of 0.10%), and Peruvian (34.6%, a difference of 0.11%).
| Demographics | Rating | Rank | In Labor Force | Age 16-19 |
| Immigrants | Pakistan | 2.0 /100 | #250 | Tragic 34.8% |
| Immigrants | Western Asia | 2.0 /100 | #251 | Tragic 34.8% |
| Immigrants | Chile | 2.0 /100 | #252 | Tragic 34.8% |
| Immigrants | Japan | 1.5 /100 | #253 | Tragic 34.7% |
| Bahamians | 1.4 /100 | #254 | Tragic 34.6% |
| Peruvians | 1.4 /100 | #255 | Tragic 34.6% |
| Immigrants | South Central Asia | 1.3 /100 | #256 | Tragic 34.6% |
| Immigrants | Egypt | 1.2 /100 | #257 | Tragic 34.6% |
| Thais | 1.2 /100 | #258 | Tragic 34.6% |
| Immigrants | Immigrants | 1.2 /100 | #259 | Tragic 34.6% |
| Egyptians | 1.2 /100 | #260 | Tragic 34.5% |
| Salvadorans | 1.1 /100 | #261 | Tragic 34.5% |
| Hispanics or Latinos | 1.1 /100 | #262 | Tragic 34.5% |
| Burmese | 1.1 /100 | #263 | Tragic 34.5% |
| Immigrants | Uruguay | 0.9 /100 | #264 | Tragic 34.4% |