Immigrants from Guatemala vs Cherokee Ambulatory Disability
COMPARE
Immigrants from Guatemala
Cherokee
Ambulatory Disability
Ambulatory Disability Comparison
Immigrants from Guatemala
Cherokee
6.2%
AMBULATORY DISABILITY
31.9/ 100
METRIC RATING
191st/ 347
METRIC RANK
7.9%
AMBULATORY DISABILITY
0.0/ 100
METRIC RATING
333rd/ 347
METRIC RANK
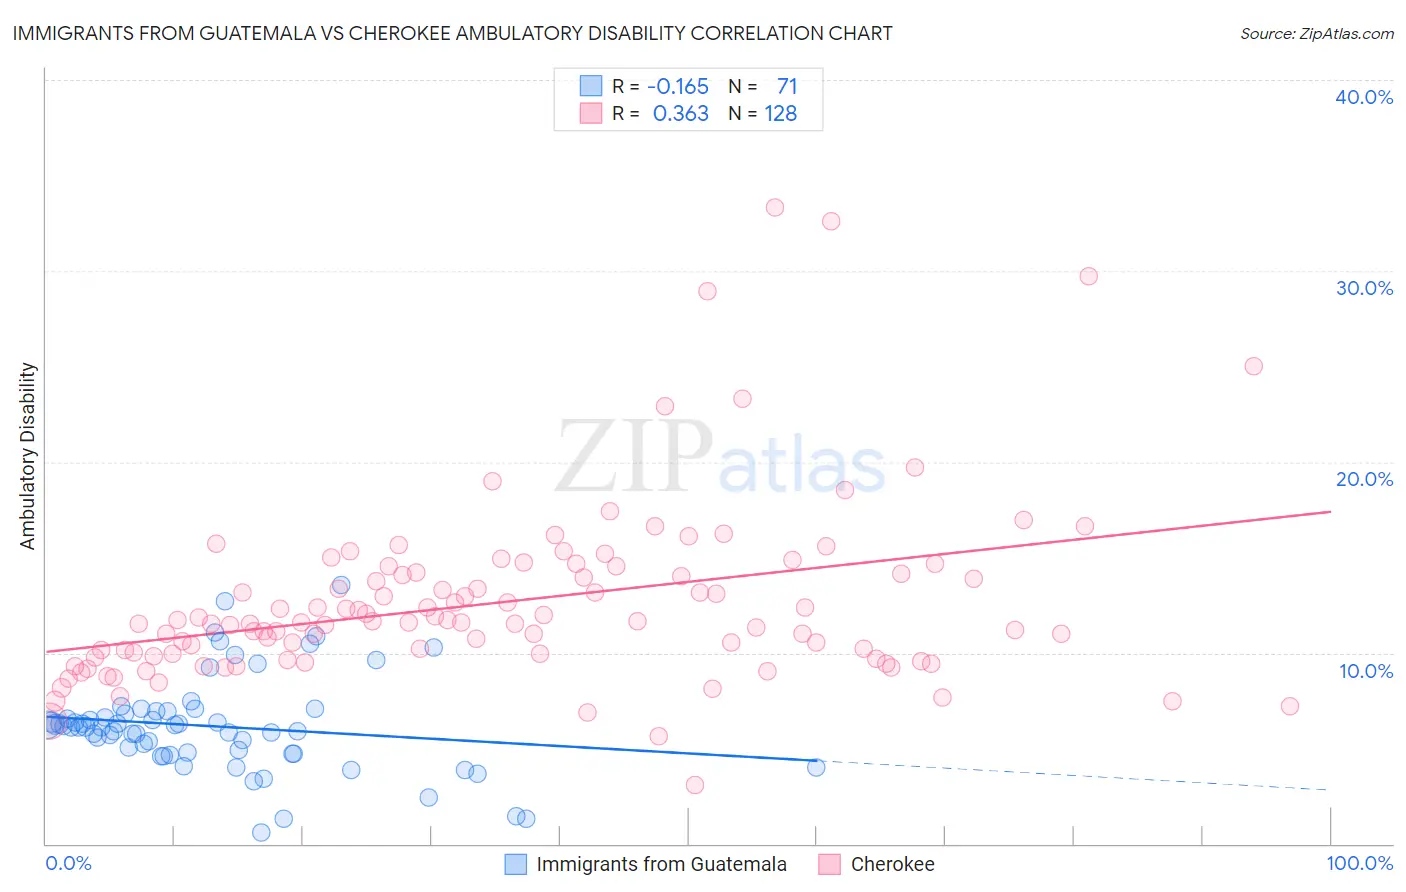
Immigrants from Guatemala vs Cherokee Ambulatory Disability Correlation Chart
The statistical analysis conducted on geographies consisting of 377,192,086 people shows a poor negative correlation between the proportion of Immigrants from Guatemala and percentage of population with ambulatory disability in the United States with a correlation coefficient (R) of -0.165 and weighted average of 6.2%. Similarly, the statistical analysis conducted on geographies consisting of 493,453,063 people shows a mild positive correlation between the proportion of Cherokee and percentage of population with ambulatory disability in the United States with a correlation coefficient (R) of 0.363 and weighted average of 7.9%, a difference of 27.4%.
Ambulatory Disability Correlation Summary
| Measurement | Immigrants from Guatemala | Cherokee |
| Minimum | 0.59% | 3.1% |
| Maximum | 13.5% | 33.3% |
| Range | 13.0% | 30.2% |
| Mean | 6.2% | 12.6% |
| Median | 6.1% | 11.6% |
| Interquartile 25% (IQ1) | 4.7% | 9.9% |
| Interquartile 75% (IQ3) | 7.0% | 14.2% |
| Interquartile Range (IQR) | 2.2% | 4.3% |
| Standard Deviation (Sample) | 2.5% | 4.7% |
| Standard Deviation (Population) | 2.5% | 4.7% |
Similar Demographics by Ambulatory Disability
Demographics Similar to Immigrants from Guatemala by Ambulatory Disability
In terms of ambulatory disability, the demographic groups most similar to Immigrants from Guatemala are Immigrants from Western Europe (6.2%, a difference of 0.020%), Immigrants from Western Africa (6.2%, a difference of 0.090%), Ukrainian (6.2%, a difference of 0.12%), Guatemalan (6.2%, a difference of 0.12%), and Alaska Native (6.2%, a difference of 0.13%).
| Demographics | Rating | Rank | Ambulatory Disability |
| Immigrants | Ghana | 41.2 /100 | #184 | Average 6.1% |
| Immigrants | Bosnia and Herzegovina | 37.2 /100 | #185 | Fair 6.2% |
| Europeans | 36.2 /100 | #186 | Fair 6.2% |
| Carpatho Rusyns | 35.3 /100 | #187 | Fair 6.2% |
| British | 34.3 /100 | #188 | Fair 6.2% |
| Ukrainians | 34.0 /100 | #189 | Fair 6.2% |
| Immigrants | Western Africa | 33.4 /100 | #190 | Fair 6.2% |
| Immigrants | Guatemala | 31.9 /100 | #191 | Fair 6.2% |
| Immigrants | Western Europe | 31.6 /100 | #192 | Fair 6.2% |
| Guatemalans | 30.0 /100 | #193 | Fair 6.2% |
| Alaska Natives | 29.8 /100 | #194 | Fair 6.2% |
| Belgians | 28.6 /100 | #195 | Fair 6.2% |
| Malaysians | 28.2 /100 | #196 | Fair 6.2% |
| Poles | 26.3 /100 | #197 | Fair 6.2% |
| Immigrants | Bangladesh | 24.6 /100 | #198 | Fair 6.2% |
Demographics Similar to Cherokee by Ambulatory Disability
In terms of ambulatory disability, the demographic groups most similar to Cherokee are Menominee (7.8%, a difference of 0.89%), Yuman (7.9%, a difference of 0.94%), Cajun (7.8%, a difference of 1.2%), Chickasaw (8.0%, a difference of 2.1%), and Seminole (8.0%, a difference of 2.1%).
| Demographics | Rating | Rank | Ambulatory Disability |
| Blacks/African Americans | 0.0 /100 | #326 | Tragic 7.5% |
| Natives/Alaskans | 0.0 /100 | #327 | Tragic 7.5% |
| Hopi | 0.0 /100 | #328 | Tragic 7.6% |
| Pueblo | 0.0 /100 | #329 | Tragic 7.6% |
| Paiute | 0.0 /100 | #330 | Tragic 7.7% |
| Cajuns | 0.0 /100 | #331 | Tragic 7.8% |
| Menominee | 0.0 /100 | #332 | Tragic 7.8% |
| Cherokee | 0.0 /100 | #333 | Tragic 7.9% |
| Yuman | 0.0 /100 | #334 | Tragic 7.9% |
| Chickasaw | 0.0 /100 | #335 | Tragic 8.0% |
| Seminole | 0.0 /100 | #336 | Tragic 8.0% |
| Dutch West Indians | 0.0 /100 | #337 | Tragic 8.2% |
| Colville | 0.0 /100 | #338 | Tragic 8.2% |
| Pima | 0.0 /100 | #339 | Tragic 8.2% |
| Choctaw | 0.0 /100 | #340 | Tragic 8.3% |