Russian vs Cherokee Ambulatory Disability
COMPARE
Russian
Cherokee
Ambulatory Disability
Ambulatory Disability Comparison
Russians
Cherokee
5.9%
AMBULATORY DISABILITY
93.4/ 100
METRIC RATING
118th/ 347
METRIC RANK
7.9%
AMBULATORY DISABILITY
0.0/ 100
METRIC RATING
333rd/ 347
METRIC RANK
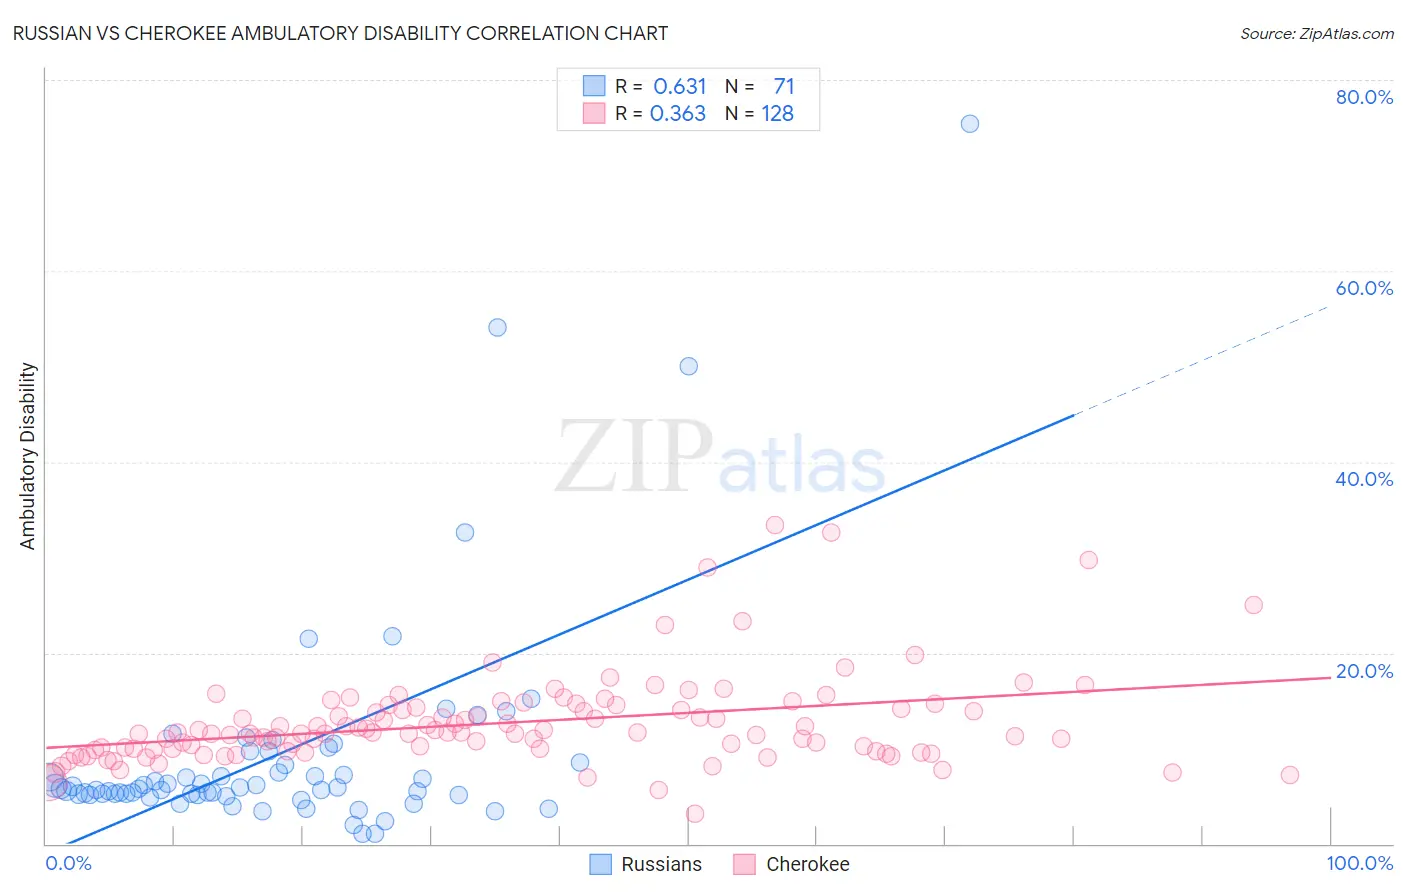
Russian vs Cherokee Ambulatory Disability Correlation Chart
The statistical analysis conducted on geographies consisting of 511,917,360 people shows a significant positive correlation between the proportion of Russians and percentage of population with ambulatory disability in the United States with a correlation coefficient (R) of 0.631 and weighted average of 5.9%. Similarly, the statistical analysis conducted on geographies consisting of 493,453,063 people shows a mild positive correlation between the proportion of Cherokee and percentage of population with ambulatory disability in the United States with a correlation coefficient (R) of 0.363 and weighted average of 7.9%, a difference of 33.4%.
Ambulatory Disability Correlation Summary
| Measurement | Russian | Cherokee |
| Minimum | 1.0% | 3.1% |
| Maximum | 75.4% | 33.3% |
| Range | 74.4% | 30.2% |
| Mean | 9.5% | 12.6% |
| Median | 5.8% | 11.6% |
| Interquartile 25% (IQ1) | 5.2% | 9.9% |
| Interquartile 75% (IQ3) | 8.5% | 14.2% |
| Interquartile Range (IQR) | 3.3% | 4.3% |
| Standard Deviation (Sample) | 11.9% | 4.7% |
| Standard Deviation (Population) | 11.9% | 4.7% |
Similar Demographics by Ambulatory Disability
Demographics Similar to Russians by Ambulatory Disability
In terms of ambulatory disability, the demographic groups most similar to Russians are Immigrants from South Eastern Asia (5.9%, a difference of 0.040%), Norwegian (5.9%, a difference of 0.080%), Estonian (5.9%, a difference of 0.11%), Costa Rican (5.9%, a difference of 0.18%), and Icelander (5.9%, a difference of 0.18%).
| Demographics | Rating | Rank | Ambulatory Disability |
| Danes | 96.6 /100 | #111 | Exceptional 5.8% |
| South Africans | 96.3 /100 | #112 | Exceptional 5.9% |
| Immigrants | Uruguay | 95.6 /100 | #113 | Exceptional 5.9% |
| Immigrants | Poland | 95.4 /100 | #114 | Exceptional 5.9% |
| South American Indians | 94.8 /100 | #115 | Exceptional 5.9% |
| Immigrants | Africa | 94.7 /100 | #116 | Exceptional 5.9% |
| Immigrants | South Eastern Asia | 93.6 /100 | #117 | Exceptional 5.9% |
| Russians | 93.4 /100 | #118 | Exceptional 5.9% |
| Norwegians | 93.1 /100 | #119 | Exceptional 5.9% |
| Estonians | 92.9 /100 | #120 | Exceptional 5.9% |
| Costa Ricans | 92.6 /100 | #121 | Exceptional 5.9% |
| Icelanders | 92.6 /100 | #122 | Exceptional 5.9% |
| Immigrants | Russia | 92.4 /100 | #123 | Exceptional 5.9% |
| Immigrants | Middle Africa | 92.2 /100 | #124 | Exceptional 5.9% |
| Koreans | 91.6 /100 | #125 | Exceptional 5.9% |
Demographics Similar to Cherokee by Ambulatory Disability
In terms of ambulatory disability, the demographic groups most similar to Cherokee are Menominee (7.8%, a difference of 0.89%), Yuman (7.9%, a difference of 0.94%), Cajun (7.8%, a difference of 1.2%), Chickasaw (8.0%, a difference of 2.1%), and Seminole (8.0%, a difference of 2.1%).
| Demographics | Rating | Rank | Ambulatory Disability |
| Blacks/African Americans | 0.0 /100 | #326 | Tragic 7.5% |
| Natives/Alaskans | 0.0 /100 | #327 | Tragic 7.5% |
| Hopi | 0.0 /100 | #328 | Tragic 7.6% |
| Pueblo | 0.0 /100 | #329 | Tragic 7.6% |
| Paiute | 0.0 /100 | #330 | Tragic 7.7% |
| Cajuns | 0.0 /100 | #331 | Tragic 7.8% |
| Menominee | 0.0 /100 | #332 | Tragic 7.8% |
| Cherokee | 0.0 /100 | #333 | Tragic 7.9% |
| Yuman | 0.0 /100 | #334 | Tragic 7.9% |
| Chickasaw | 0.0 /100 | #335 | Tragic 8.0% |
| Seminole | 0.0 /100 | #336 | Tragic 8.0% |
| Dutch West Indians | 0.0 /100 | #337 | Tragic 8.2% |
| Colville | 0.0 /100 | #338 | Tragic 8.2% |
| Pima | 0.0 /100 | #339 | Tragic 8.2% |
| Choctaw | 0.0 /100 | #340 | Tragic 8.3% |