Yaqui vs Slovak In Labor Force | Age 16-19
COMPARE
Yaqui
Slovak
In Labor Force | Age 16-19
In Labor Force | Age 16-19 Comparison
Yaqui
Slovaks
37.1%
IN LABOR FORCE | AGE 16-19
74.4/ 100
METRIC RATING
159th/ 347
METRIC RANK
42.6%
IN LABOR FORCE | AGE 16-19
100.0/ 100
METRIC RATING
23rd/ 347
METRIC RANK
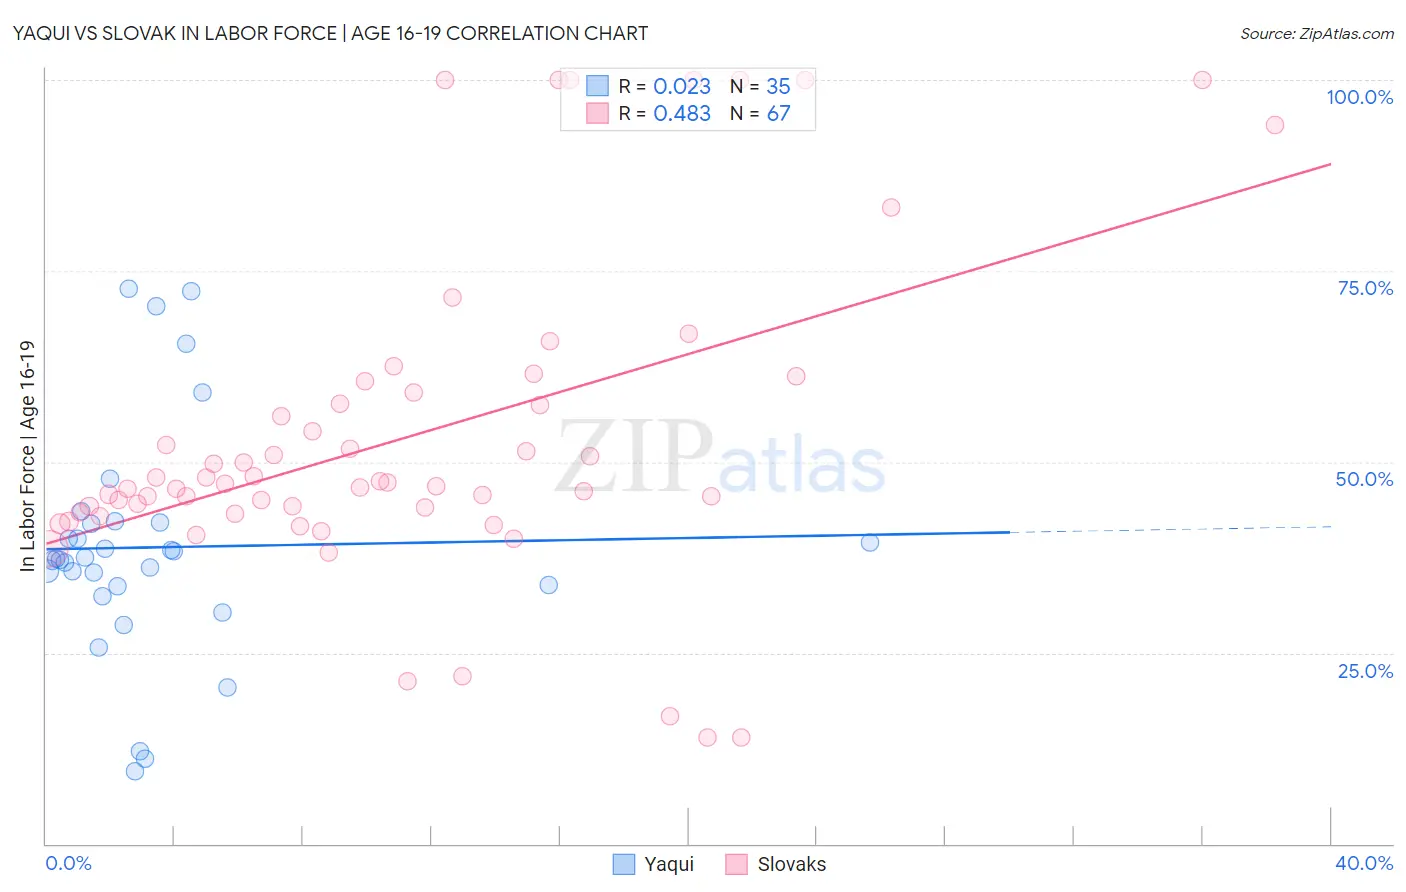
Yaqui vs Slovak In Labor Force | Age 16-19 Correlation Chart
The statistical analysis conducted on geographies consisting of 107,656,749 people shows no correlation between the proportion of Yaqui and labor force participation rate among population between the ages 16 and 19 in the United States with a correlation coefficient (R) of 0.023 and weighted average of 37.1%. Similarly, the statistical analysis conducted on geographies consisting of 396,947,600 people shows a moderate positive correlation between the proportion of Slovaks and labor force participation rate among population between the ages 16 and 19 in the United States with a correlation coefficient (R) of 0.483 and weighted average of 42.6%, a difference of 15.0%.
In Labor Force | Age 16-19 Correlation Summary
| Measurement | Yaqui | Slovak |
| Minimum | 9.5% | 13.9% |
| Maximum | 72.6% | 100.0% |
| Range | 63.1% | 86.1% |
| Mean | 38.8% | 53.2% |
| Median | 37.3% | 47.1% |
| Interquartile 25% (IQ1) | 33.7% | 43.4% |
| Interquartile 75% (IQ3) | 42.1% | 59.1% |
| Interquartile Range (IQR) | 8.4% | 15.7% |
| Standard Deviation (Sample) | 15.0% | 20.7% |
| Standard Deviation (Population) | 14.8% | 20.6% |
Similar Demographics by In Labor Force | Age 16-19
Demographics Similar to Yaqui by In Labor Force | Age 16-19
In terms of in labor force | age 16-19, the demographic groups most similar to Yaqui are Immigrants from Saudi Arabia (37.0%, a difference of 0.030%), Ute (37.1%, a difference of 0.080%), Immigrants from Brazil (37.1%, a difference of 0.14%), Cambodian (37.0%, a difference of 0.18%), and Immigrants from Jordan (36.9%, a difference of 0.31%).
| Demographics | Rating | Rank | In Labor Force | Age 16-19 |
| Immigrants | Sierra Leone | 83.6 /100 | #152 | Excellent 37.3% |
| Arapaho | 81.8 /100 | #153 | Excellent 37.3% |
| Immigrants | Bulgaria | 81.6 /100 | #154 | Excellent 37.3% |
| Immigrants | Lithuania | 80.7 /100 | #155 | Excellent 37.2% |
| Kiowa | 80.4 /100 | #156 | Excellent 37.2% |
| Immigrants | Brazil | 76.5 /100 | #157 | Good 37.1% |
| Ute | 75.7 /100 | #158 | Good 37.1% |
| Yaqui | 74.4 /100 | #159 | Good 37.1% |
| Immigrants | Saudi Arabia | 73.9 /100 | #160 | Good 37.0% |
| Cambodians | 71.5 /100 | #161 | Good 37.0% |
| Immigrants | Jordan | 69.5 /100 | #162 | Good 36.9% |
| Bermudans | 69.3 /100 | #163 | Good 36.9% |
| Immigrants | Kuwait | 68.9 /100 | #164 | Good 36.9% |
| Yakama | 66.9 /100 | #165 | Good 36.9% |
| Immigrants | Western Africa | 66.7 /100 | #166 | Good 36.9% |
Demographics Similar to Slovaks by In Labor Force | Age 16-19
In terms of in labor force | age 16-19, the demographic groups most similar to Slovaks are Bangladeshi (42.5%, a difference of 0.33%), German Russian (42.4%, a difference of 0.41%), English (42.4%, a difference of 0.54%), Sudanese (42.9%, a difference of 0.59%), and Welsh (42.3%, a difference of 0.81%).
| Demographics | Rating | Rank | In Labor Force | Age 16-19 |
| Czechs | 100.0 /100 | #16 | Exceptional 43.6% |
| Scandinavians | 100.0 /100 | #17 | Exceptional 43.6% |
| French Canadians | 100.0 /100 | #18 | Exceptional 43.6% |
| Belgians | 100.0 /100 | #19 | Exceptional 43.4% |
| Swiss | 100.0 /100 | #20 | Exceptional 43.3% |
| Ottawa | 100.0 /100 | #21 | Exceptional 43.0% |
| Sudanese | 100.0 /100 | #22 | Exceptional 42.9% |
| Slovaks | 100.0 /100 | #23 | Exceptional 42.6% |
| Bangladeshis | 100.0 /100 | #24 | Exceptional 42.5% |
| German Russians | 100.0 /100 | #25 | Exceptional 42.4% |
| English | 100.0 /100 | #26 | Exceptional 42.4% |
| Welsh | 100.0 /100 | #27 | Exceptional 42.3% |
| Poles | 100.0 /100 | #28 | Exceptional 42.1% |
| French | 100.0 /100 | #29 | Exceptional 42.1% |
| Scottish | 100.0 /100 | #30 | Exceptional 42.0% |