Yaqui vs Slovak Married-couple Households
COMPARE
Yaqui
Slovak
Married-couple Households
Married-couple Households Comparison
Yaqui
Slovaks
44.5%
MARRIED-COUPLE HOUSEHOLDS
1.2/ 100
METRIC RATING
236th/ 347
METRIC RANK
47.6%
MARRIED-COUPLE HOUSEHOLDS
92.9/ 100
METRIC RATING
115th/ 347
METRIC RANK
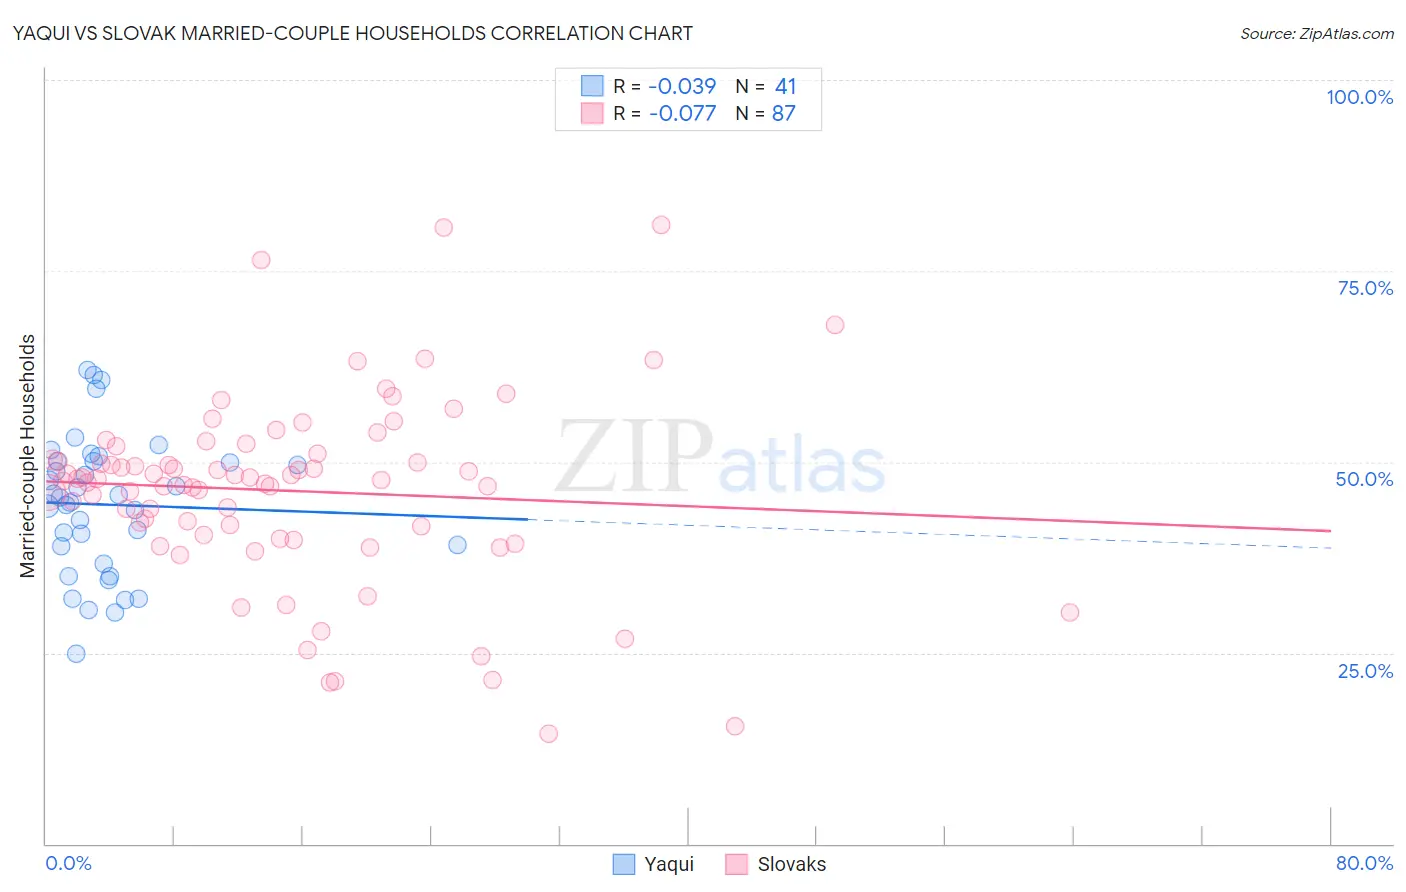
Yaqui vs Slovak Married-couple Households Correlation Chart
The statistical analysis conducted on geographies consisting of 107,720,236 people shows no correlation between the proportion of Yaqui and percentage of married-couple family households in the United States with a correlation coefficient (R) of -0.039 and weighted average of 44.5%. Similarly, the statistical analysis conducted on geographies consisting of 397,658,026 people shows a slight negative correlation between the proportion of Slovaks and percentage of married-couple family households in the United States with a correlation coefficient (R) of -0.077 and weighted average of 47.6%, a difference of 6.8%.
Married-couple Households Correlation Summary
| Measurement | Yaqui | Slovak |
| Minimum | 25.0% | 14.5% |
| Maximum | 62.1% | 81.0% |
| Range | 37.1% | 66.6% |
| Mean | 44.4% | 46.2% |
| Median | 45.4% | 47.7% |
| Interquartile 25% (IQ1) | 37.8% | 40.4% |
| Interquartile 75% (IQ3) | 50.2% | 51.1% |
| Interquartile Range (IQR) | 12.4% | 10.7% |
| Standard Deviation (Sample) | 9.0% | 12.3% |
| Standard Deviation (Population) | 8.9% | 12.3% |
Similar Demographics by Married-couple Households
Demographics Similar to Yaqui by Married-couple Households
In terms of married-couple households, the demographic groups most similar to Yaqui are Immigrants from Nicaragua (44.5%, a difference of 0.0%), Comanche (44.5%, a difference of 0.030%), Immigrants from Panama (44.6%, a difference of 0.080%), Immigrants from Uruguay (44.5%, a difference of 0.080%), and Spanish American (44.5%, a difference of 0.10%).
| Demographics | Rating | Rank | Married-couple Households |
| Immigrants | Latin America | 1.6 /100 | #229 | Tragic 44.7% |
| Soviet Union | 1.6 /100 | #230 | Tragic 44.6% |
| Houma | 1.5 /100 | #231 | Tragic 44.6% |
| Marshallese | 1.5 /100 | #232 | Tragic 44.6% |
| Immigrants | Uganda | 1.5 /100 | #233 | Tragic 44.6% |
| Immigrants | Panama | 1.3 /100 | #234 | Tragic 44.6% |
| Immigrants | Nicaragua | 1.2 /100 | #235 | Tragic 44.5% |
| Yaqui | 1.2 /100 | #236 | Tragic 44.5% |
| Comanche | 1.2 /100 | #237 | Tragic 44.5% |
| Immigrants | Uruguay | 1.1 /100 | #238 | Tragic 44.5% |
| Spanish Americans | 1.1 /100 | #239 | Tragic 44.5% |
| Ute | 1.0 /100 | #240 | Tragic 44.4% |
| Immigrants | Bosnia and Herzegovina | 1.0 /100 | #241 | Tragic 44.4% |
| Immigrants | Albania | 1.0 /100 | #242 | Tragic 44.4% |
| Immigrants | Saudi Arabia | 0.9 /100 | #243 | Tragic 44.4% |
Demographics Similar to Slovaks by Married-couple Households
In terms of married-couple households, the demographic groups most similar to Slovaks are Argentinean (47.5%, a difference of 0.050%), French Canadian (47.5%, a difference of 0.060%), Immigrants from Germany (47.5%, a difference of 0.070%), Chilean (47.5%, a difference of 0.10%), and Immigrants from Europe (47.6%, a difference of 0.12%).
| Demographics | Rating | Rank | Married-couple Households |
| Immigrants | Japan | 94.4 /100 | #108 | Exceptional 47.7% |
| Immigrants | Jordan | 94.1 /100 | #109 | Exceptional 47.7% |
| Macedonians | 93.9 /100 | #110 | Exceptional 47.6% |
| Syrians | 93.9 /100 | #111 | Exceptional 47.6% |
| Peruvians | 93.8 /100 | #112 | Exceptional 47.6% |
| Venezuelans | 93.8 /100 | #113 | Exceptional 47.6% |
| Immigrants | Europe | 93.7 /100 | #114 | Exceptional 47.6% |
| Slovaks | 92.9 /100 | #115 | Exceptional 47.6% |
| Argentineans | 92.5 /100 | #116 | Exceptional 47.5% |
| French Canadians | 92.4 /100 | #117 | Exceptional 47.5% |
| Immigrants | Germany | 92.4 /100 | #118 | Exceptional 47.5% |
| Chileans | 92.2 /100 | #119 | Exceptional 47.5% |
| Puget Sound Salish | 90.5 /100 | #120 | Exceptional 47.4% |
| Immigrants | Eastern Europe | 90.3 /100 | #121 | Exceptional 47.4% |
| Okinawans | 90.1 /100 | #122 | Exceptional 47.4% |