Immigrants from Denmark vs Slovak Male Disability
COMPARE
Immigrants from Denmark
Slovak
Male Disability
Male Disability Comparison
Immigrants from Denmark
Slovaks
11.0%
MALE DISABILITY
76.4/ 100
METRIC RATING
149th/ 347
METRIC RANK
12.7%
MALE DISABILITY
0.0/ 100
METRIC RATING
279th/ 347
METRIC RANK
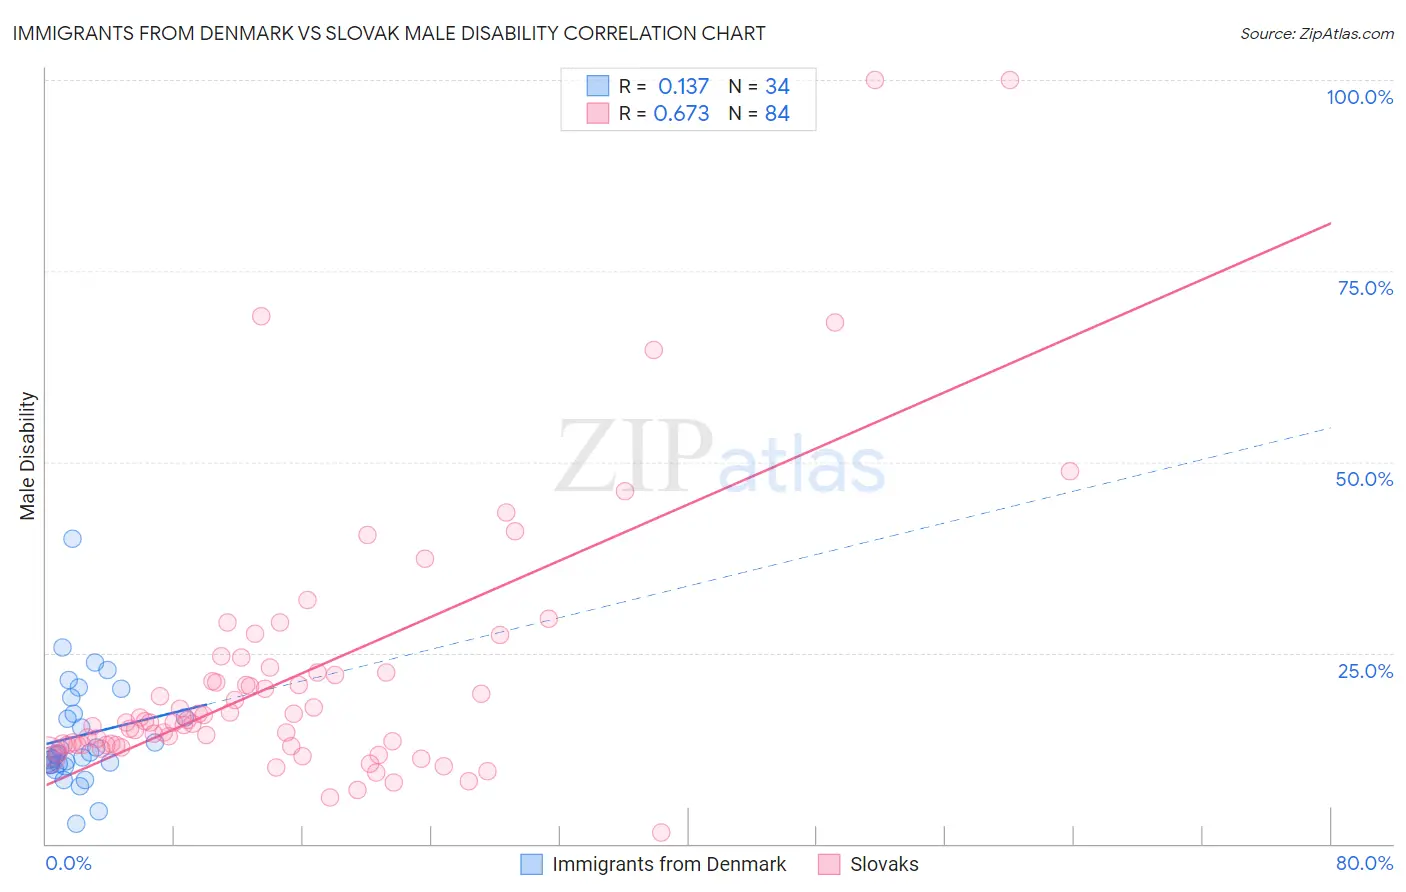
Immigrants from Denmark vs Slovak Male Disability Correlation Chart
The statistical analysis conducted on geographies consisting of 136,428,328 people shows a poor positive correlation between the proportion of Immigrants from Denmark and percentage of males with a disability in the United States with a correlation coefficient (R) of 0.137 and weighted average of 11.0%. Similarly, the statistical analysis conducted on geographies consisting of 397,843,649 people shows a significant positive correlation between the proportion of Slovaks and percentage of males with a disability in the United States with a correlation coefficient (R) of 0.673 and weighted average of 12.7%, a difference of 15.0%.
Male Disability Correlation Summary
| Measurement | Immigrants from Denmark | Slovak |
| Minimum | 2.7% | 1.5% |
| Maximum | 40.0% | 100.0% |
| Range | 37.3% | 98.5% |
| Mean | 14.1% | 21.9% |
| Median | 11.7% | 15.9% |
| Interquartile 25% (IQ1) | 10.3% | 12.9% |
| Interquartile 75% (IQ3) | 17.0% | 22.4% |
| Interquartile Range (IQR) | 6.7% | 9.5% |
| Standard Deviation (Sample) | 7.1% | 17.7% |
| Standard Deviation (Population) | 7.0% | 17.6% |
Similar Demographics by Male Disability
Demographics Similar to Immigrants from Denmark by Male Disability
In terms of male disability, the demographic groups most similar to Immigrants from Denmark are Sudanese (11.0%, a difference of 0.060%), Immigrants from Croatia (11.0%, a difference of 0.070%), Korean (11.0%, a difference of 0.090%), Immigrants from Guatemala (11.0%, a difference of 0.10%), and Cuban (11.0%, a difference of 0.12%).
| Demographics | Rating | Rank | Male Disability |
| Immigrants | Sudan | 81.5 /100 | #142 | Excellent 11.0% |
| Moroccans | 80.7 /100 | #143 | Excellent 11.0% |
| Kenyans | 78.1 /100 | #144 | Good 11.0% |
| Costa Ricans | 78.0 /100 | #145 | Good 11.0% |
| Koreans | 77.5 /100 | #146 | Good 11.0% |
| Immigrants | Croatia | 77.3 /100 | #147 | Good 11.0% |
| Sudanese | 77.1 /100 | #148 | Good 11.0% |
| Immigrants | Denmark | 76.4 /100 | #149 | Good 11.0% |
| Immigrants | Guatemala | 75.1 /100 | #150 | Good 11.0% |
| Cubans | 74.9 /100 | #151 | Good 11.0% |
| Immigrants | Albania | 74.4 /100 | #152 | Good 11.0% |
| Immigrants | Northern Europe | 73.2 /100 | #153 | Good 11.1% |
| Immigrants | Moldova | 72.8 /100 | #154 | Good 11.1% |
| Immigrants | Middle Africa | 70.9 /100 | #155 | Good 11.1% |
| Russians | 69.8 /100 | #156 | Good 11.1% |
Demographics Similar to Slovaks by Male Disability
In terms of male disability, the demographic groups most similar to Slovaks are Dutch (12.7%, a difference of 0.050%), Sioux (12.7%, a difference of 0.11%), Central American Indian (12.7%, a difference of 0.15%), Irish (12.7%, a difference of 0.16%), and German (12.7%, a difference of 0.17%).
| Demographics | Rating | Rank | Male Disability |
| Hmong | 0.0 /100 | #272 | Tragic 12.5% |
| Native Hawaiians | 0.0 /100 | #273 | Tragic 12.5% |
| Hopi | 0.0 /100 | #274 | Tragic 12.5% |
| Fijians | 0.0 /100 | #275 | Tragic 12.6% |
| Africans | 0.0 /100 | #276 | Tragic 12.6% |
| Finns | 0.0 /100 | #277 | Tragic 12.6% |
| Central American Indians | 0.0 /100 | #278 | Tragic 12.7% |
| Slovaks | 0.0 /100 | #279 | Tragic 12.7% |
| Dutch | 0.0 /100 | #280 | Tragic 12.7% |
| Sioux | 0.0 /100 | #281 | Tragic 12.7% |
| Irish | 0.0 /100 | #282 | Tragic 12.7% |
| Germans | 0.0 /100 | #283 | Tragic 12.7% |
| Spanish | 0.0 /100 | #284 | Tragic 12.7% |
| Welsh | 0.0 /100 | #285 | Tragic 12.7% |
| Scottish | 0.0 /100 | #286 | Tragic 12.8% |