Yaqui vs Paraguayan Single Father Households
COMPARE
Yaqui
Paraguayan
Single Father Households
Single Father Households Comparison
Yaqui
Paraguayans
3.2%
SINGLE FATHER HOUSEHOLDS
0.0/ 100
METRIC RATING
332nd/ 347
METRIC RANK
2.1%
SINGLE FATHER HOUSEHOLDS
99.9/ 100
METRIC RATING
65th/ 347
METRIC RANK
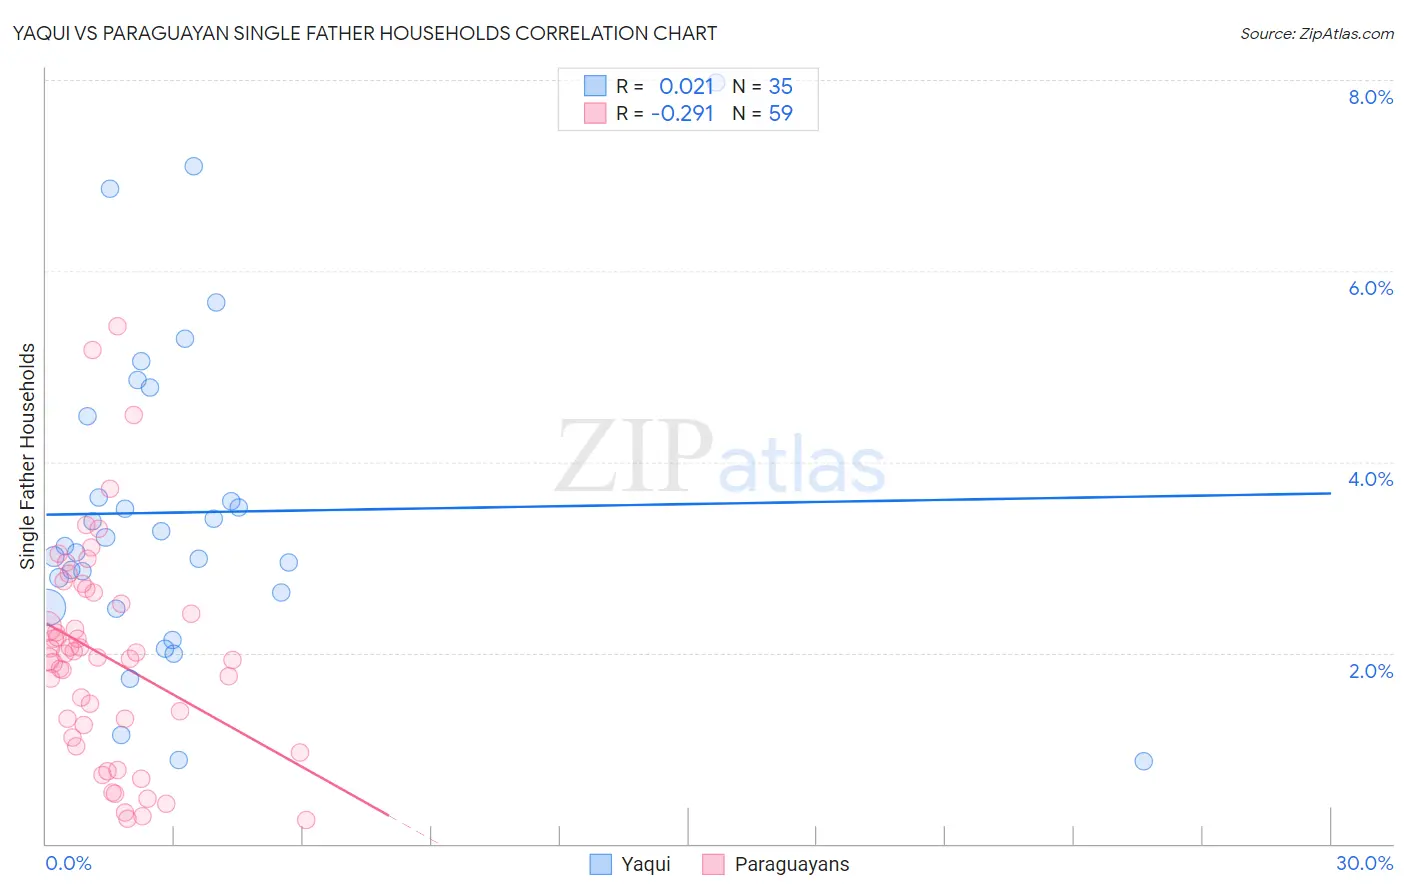
Yaqui vs Paraguayan Single Father Households Correlation Chart
The statistical analysis conducted on geographies consisting of 107,422,913 people shows no correlation between the proportion of Yaqui and percentage of single father households in the United States with a correlation coefficient (R) of 0.021 and weighted average of 3.2%. Similarly, the statistical analysis conducted on geographies consisting of 94,899,584 people shows a weak negative correlation between the proportion of Paraguayans and percentage of single father households in the United States with a correlation coefficient (R) of -0.291 and weighted average of 2.1%, a difference of 55.4%.
Single Father Households Correlation Summary
| Measurement | Yaqui | Paraguayan |
| Minimum | 0.87% | 0.25% |
| Maximum | 8.0% | 5.4% |
| Range | 7.1% | 5.2% |
| Mean | 3.5% | 2.0% |
| Median | 3.1% | 2.0% |
| Interquartile 25% (IQ1) | 2.5% | 1.1% |
| Interquartile 75% (IQ3) | 4.5% | 2.6% |
| Interquartile Range (IQR) | 2.0% | 1.5% |
| Standard Deviation (Sample) | 1.7% | 1.1% |
| Standard Deviation (Population) | 1.6% | 1.1% |
Similar Demographics by Single Father Households
Demographics Similar to Yaqui by Single Father Households
In terms of single father households, the demographic groups most similar to Yaqui are Navajo (3.2%, a difference of 0.040%), Native/Alaskan (3.2%, a difference of 0.49%), Nepalese (3.1%, a difference of 2.3%), Chippewa (3.1%, a difference of 3.2%), and Yuman (3.3%, a difference of 3.3%).
| Demographics | Rating | Rank | Single Father Households |
| Immigrants | Mexico | 0.0 /100 | #325 | Tragic 3.0% |
| Aleuts | 0.0 /100 | #326 | Tragic 3.0% |
| Bangladeshis | 0.0 /100 | #327 | Tragic 3.1% |
| Immigrants | Cabo Verde | 0.0 /100 | #328 | Tragic 3.1% |
| Chippewa | 0.0 /100 | #329 | Tragic 3.1% |
| Nepalese | 0.0 /100 | #330 | Tragic 3.1% |
| Navajo | 0.0 /100 | #331 | Tragic 3.2% |
| Yaqui | 0.0 /100 | #332 | Tragic 3.2% |
| Natives/Alaskans | 0.0 /100 | #333 | Tragic 3.2% |
| Yuman | 0.0 /100 | #334 | Tragic 3.3% |
| Colville | 0.0 /100 | #335 | Tragic 3.3% |
| Paiute | 0.0 /100 | #336 | Tragic 3.3% |
| Pueblo | 0.0 /100 | #337 | Tragic 3.3% |
| Sioux | 0.0 /100 | #338 | Tragic 3.3% |
| Alaskan Athabascans | 0.0 /100 | #339 | Tragic 3.4% |
Demographics Similar to Paraguayans by Single Father Households
In terms of single father households, the demographic groups most similar to Paraguayans are Mongolian (2.1%, a difference of 0.030%), Maltese (2.0%, a difference of 0.17%), Immigrants from Western Asia (2.1%, a difference of 0.36%), Immigrants from Malaysia (2.0%, a difference of 0.37%), and Immigrants from Italy (2.1%, a difference of 0.41%).
| Demographics | Rating | Rank | Single Father Households |
| Immigrants | Czechoslovakia | 99.9 /100 | #58 | Exceptional 2.0% |
| Immigrants | North Macedonia | 99.9 /100 | #59 | Exceptional 2.0% |
| Immigrants | Austria | 99.9 /100 | #60 | Exceptional 2.0% |
| Vietnamese | 99.9 /100 | #61 | Exceptional 2.0% |
| Immigrants | Malaysia | 99.9 /100 | #62 | Exceptional 2.0% |
| Maltese | 99.9 /100 | #63 | Exceptional 2.0% |
| Mongolians | 99.9 /100 | #64 | Exceptional 2.1% |
| Paraguayans | 99.9 /100 | #65 | Exceptional 2.1% |
| Immigrants | Western Asia | 99.8 /100 | #66 | Exceptional 2.1% |
| Immigrants | Italy | 99.8 /100 | #67 | Exceptional 2.1% |
| Immigrants | Denmark | 99.8 /100 | #68 | Exceptional 2.1% |
| Immigrants | Romania | 99.8 /100 | #69 | Exceptional 2.1% |
| Egyptians | 99.8 /100 | #70 | Exceptional 2.1% |
| Immigrants | Kuwait | 99.8 /100 | #71 | Exceptional 2.1% |
| Immigrants | Spain | 99.8 /100 | #72 | Exceptional 2.1% |