Immigrants from Chile vs Paraguayan Self-Care Disability
COMPARE
Immigrants from Chile
Paraguayan
Self-Care Disability
Self-Care Disability Comparison
Immigrants from Chile
Paraguayans
2.4%
SELF-CARE DISABILITY
96.7/ 100
METRIC RATING
96th/ 347
METRIC RANK
2.3%
SELF-CARE DISABILITY
99.9/ 100
METRIC RATING
30th/ 347
METRIC RANK
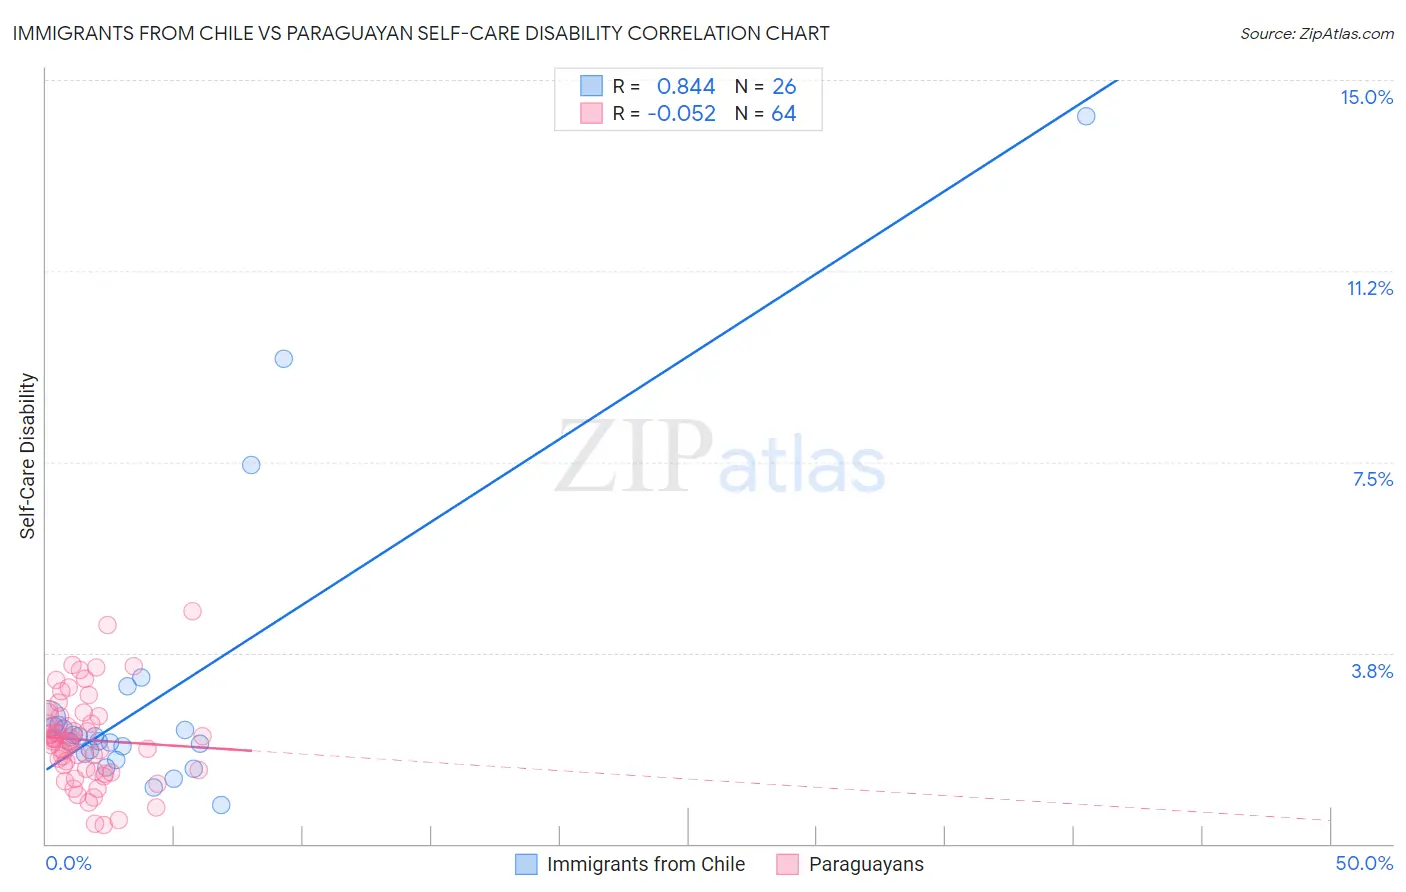
Immigrants from Chile vs Paraguayan Self-Care Disability Correlation Chart
The statistical analysis conducted on geographies consisting of 218,576,088 people shows a very strong positive correlation between the proportion of Immigrants from Chile and percentage of population with self-care disability in the United States with a correlation coefficient (R) of 0.844 and weighted average of 2.4%. Similarly, the statistical analysis conducted on geographies consisting of 95,092,282 people shows a slight negative correlation between the proportion of Paraguayans and percentage of population with self-care disability in the United States with a correlation coefficient (R) of -0.052 and weighted average of 2.3%, a difference of 4.9%.
Self-Care Disability Correlation Summary
| Measurement | Immigrants from Chile | Paraguayan |
| Minimum | 0.76% | 0.38% |
| Maximum | 14.3% | 4.6% |
| Range | 13.5% | 4.2% |
| Mean | 3.0% | 2.0% |
| Median | 2.1% | 2.0% |
| Interquartile 25% (IQ1) | 1.8% | 1.4% |
| Interquartile 75% (IQ3) | 2.3% | 2.5% |
| Interquartile Range (IQR) | 0.58% | 1.1% |
| Standard Deviation (Sample) | 3.0% | 0.88% |
| Standard Deviation (Population) | 2.9% | 0.87% |
Similar Demographics by Self-Care Disability
Demographics Similar to Immigrants from Chile by Self-Care Disability
In terms of self-care disability, the demographic groups most similar to Immigrants from Chile are Swiss (2.4%, a difference of 0.040%), Immigrants from Asia (2.4%, a difference of 0.060%), Macedonian (2.4%, a difference of 0.070%), Immigrants from Latvia (2.4%, a difference of 0.11%), and Immigrants from Poland (2.4%, a difference of 0.14%).
| Demographics | Rating | Rank | Self-Care Disability |
| Immigrants | Congo | 98.0 /100 | #89 | Exceptional 2.4% |
| Immigrants | Czechoslovakia | 97.7 /100 | #90 | Exceptional 2.4% |
| Immigrants | Jordan | 97.7 /100 | #91 | Exceptional 2.4% |
| Icelanders | 97.4 /100 | #92 | Exceptional 2.4% |
| Immigrants | Latvia | 97.0 /100 | #93 | Exceptional 2.4% |
| Macedonians | 96.9 /100 | #94 | Exceptional 2.4% |
| Immigrants | Asia | 96.9 /100 | #95 | Exceptional 2.4% |
| Immigrants | Chile | 96.7 /100 | #96 | Exceptional 2.4% |
| Swiss | 96.6 /100 | #97 | Exceptional 2.4% |
| Immigrants | Poland | 96.4 /100 | #98 | Exceptional 2.4% |
| Immigrants | Israel | 96.1 /100 | #99 | Exceptional 2.4% |
| Europeans | 95.8 /100 | #100 | Exceptional 2.4% |
| Immigrants | Scotland | 95.7 /100 | #101 | Exceptional 2.4% |
| Croatians | 95.0 /100 | #102 | Exceptional 2.4% |
| Alsatians | 94.9 /100 | #103 | Exceptional 2.4% |
Demographics Similar to Paraguayans by Self-Care Disability
In terms of self-care disability, the demographic groups most similar to Paraguayans are Danish (2.3%, a difference of 0.010%), Burmese (2.3%, a difference of 0.080%), Immigrants from Korea (2.3%, a difference of 0.31%), Immigrants from Zimbabwe (2.3%, a difference of 0.33%), and Immigrants from Turkey (2.3%, a difference of 0.37%).
| Demographics | Rating | Rank | Self-Care Disability |
| Cambodians | 100.0 /100 | #23 | Exceptional 2.2% |
| Cypriots | 100.0 /100 | #24 | Exceptional 2.2% |
| Turks | 100.0 /100 | #25 | Exceptional 2.2% |
| Immigrants | Sri Lanka | 99.9 /100 | #26 | Exceptional 2.2% |
| Venezuelans | 99.9 /100 | #27 | Exceptional 2.2% |
| Inupiat | 99.9 /100 | #28 | Exceptional 2.2% |
| Immigrants | Zimbabwe | 99.9 /100 | #29 | Exceptional 2.3% |
| Paraguayans | 99.9 /100 | #30 | Exceptional 2.3% |
| Danes | 99.9 /100 | #31 | Exceptional 2.3% |
| Burmese | 99.9 /100 | #32 | Exceptional 2.3% |
| Immigrants | Korea | 99.9 /100 | #33 | Exceptional 2.3% |
| Immigrants | Turkey | 99.9 /100 | #34 | Exceptional 2.3% |
| Immigrants | Australia | 99.9 /100 | #35 | Exceptional 2.3% |
| Immigrants | Lithuania | 99.9 /100 | #36 | Exceptional 2.3% |
| Immigrants | Sweden | 99.9 /100 | #37 | Exceptional 2.3% |