Yaqui vs Paraguayan Associate's Degree
COMPARE
Yaqui
Paraguayan
Associate's Degree
Associate's Degree Comparison
Yaqui
Paraguayans
37.6%
ASSOCIATE'S DEGREE
0.0/ 100
METRIC RATING
317th/ 347
METRIC RANK
51.8%
ASSOCIATE'S DEGREE
99.8/ 100
METRIC RATING
57th/ 347
METRIC RANK
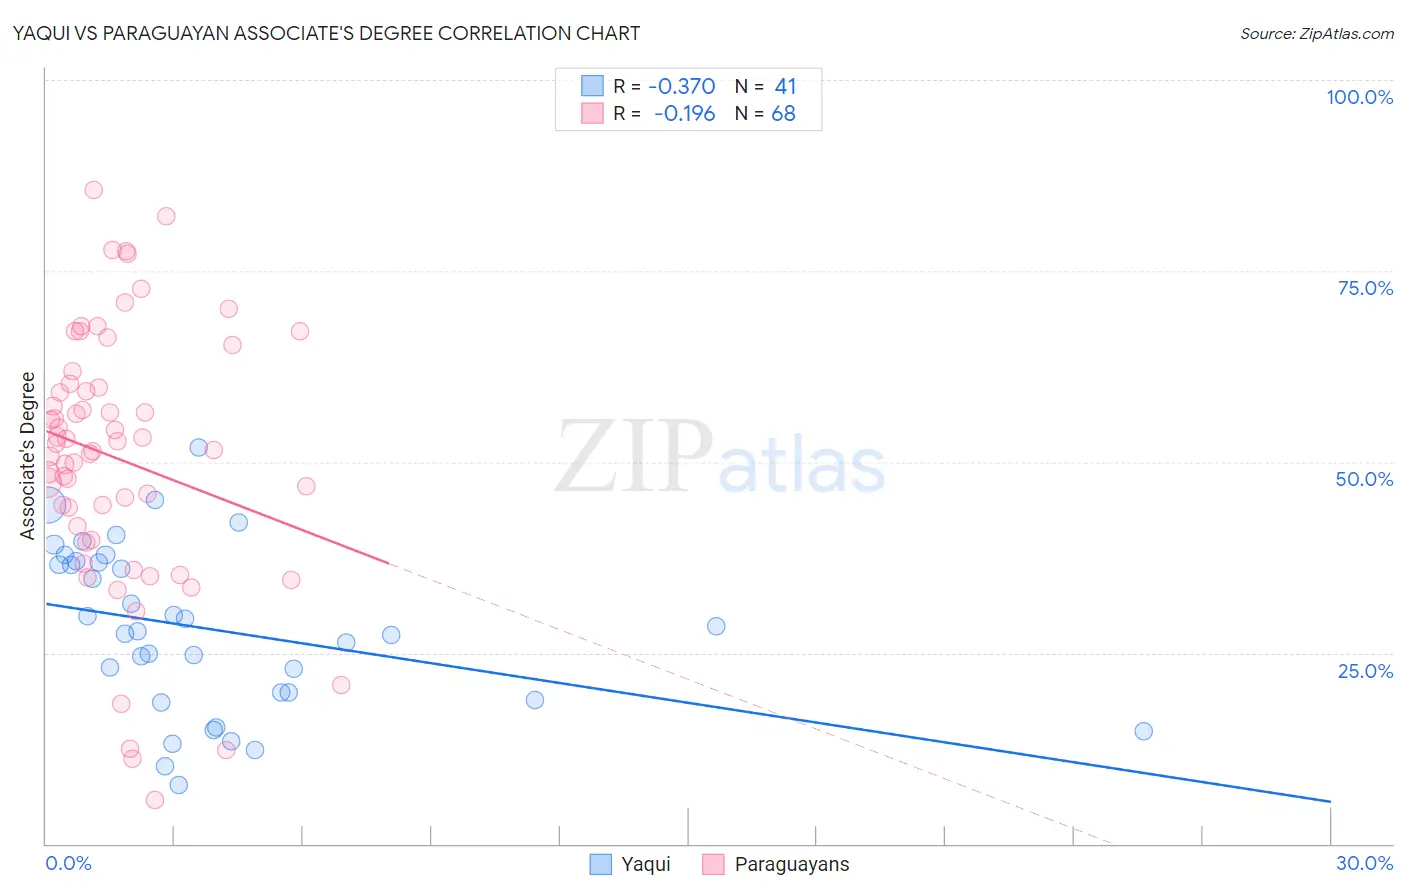
Yaqui vs Paraguayan Associate's Degree Correlation Chart
The statistical analysis conducted on geographies consisting of 107,738,640 people shows a mild negative correlation between the proportion of Yaqui and percentage of population with at least associate's degree education in the United States with a correlation coefficient (R) of -0.370 and weighted average of 37.6%. Similarly, the statistical analysis conducted on geographies consisting of 95,113,072 people shows a poor negative correlation between the proportion of Paraguayans and percentage of population with at least associate's degree education in the United States with a correlation coefficient (R) of -0.196 and weighted average of 51.8%, a difference of 38.0%.
Associate's Degree Correlation Summary
| Measurement | Yaqui | Paraguayan |
| Minimum | 7.7% | 5.7% |
| Maximum | 51.9% | 85.7% |
| Range | 44.1% | 79.9% |
| Mean | 28.1% | 50.4% |
| Median | 27.8% | 52.0% |
| Interquartile 25% (IQ1) | 19.2% | 40.7% |
| Interquartile 75% (IQ3) | 36.9% | 60.0% |
| Interquartile Range (IQR) | 17.7% | 19.3% |
| Standard Deviation (Sample) | 10.8% | 17.1% |
| Standard Deviation (Population) | 10.7% | 17.0% |
Similar Demographics by Associate's Degree
Demographics Similar to Yaqui by Associate's Degree
In terms of associate's degree, the demographic groups most similar to Yaqui are Creek (37.6%, a difference of 0.020%), Crow (37.6%, a difference of 0.020%), Alaska Native (37.5%, a difference of 0.23%), Seminole (37.7%, a difference of 0.41%), and Fijian (37.4%, a difference of 0.45%).
| Demographics | Rating | Rank | Associate's Degree |
| Immigrants | Dominican Republic | 0.0 /100 | #310 | Tragic 37.9% |
| Immigrants | Latin America | 0.0 /100 | #311 | Tragic 37.9% |
| Choctaw | 0.0 /100 | #312 | Tragic 37.8% |
| Hispanics or Latinos | 0.0 /100 | #313 | Tragic 37.7% |
| Seminole | 0.0 /100 | #314 | Tragic 37.7% |
| Creek | 0.0 /100 | #315 | Tragic 37.6% |
| Crow | 0.0 /100 | #316 | Tragic 37.6% |
| Yaqui | 0.0 /100 | #317 | Tragic 37.6% |
| Alaska Natives | 0.0 /100 | #318 | Tragic 37.5% |
| Fijians | 0.0 /100 | #319 | Tragic 37.4% |
| Cajuns | 0.0 /100 | #320 | Tragic 37.4% |
| Immigrants | Yemen | 0.0 /100 | #321 | Tragic 37.3% |
| Pennsylvania Germans | 0.0 /100 | #322 | Tragic 37.2% |
| Immigrants | Cabo Verde | 0.0 /100 | #323 | Tragic 36.8% |
| Arapaho | 0.0 /100 | #324 | Tragic 36.7% |
Demographics Similar to Paraguayans by Associate's Degree
In terms of associate's degree, the demographic groups most similar to Paraguayans are New Zealander (51.8%, a difference of 0.030%), Immigrants from Czechoslovakia (51.9%, a difference of 0.12%), Australian (51.9%, a difference of 0.14%), Immigrants from Serbia (51.7%, a difference of 0.16%), and Immigrants from Spain (51.9%, a difference of 0.17%).
| Demographics | Rating | Rank | Associate's Degree |
| Asians | 99.9 /100 | #50 | Exceptional 52.1% |
| Immigrants | Greece | 99.9 /100 | #51 | Exceptional 52.1% |
| Bolivians | 99.8 /100 | #52 | Exceptional 52.0% |
| Immigrants | Asia | 99.8 /100 | #53 | Exceptional 52.0% |
| Immigrants | Spain | 99.8 /100 | #54 | Exceptional 51.9% |
| Australians | 99.8 /100 | #55 | Exceptional 51.9% |
| Immigrants | Czechoslovakia | 99.8 /100 | #56 | Exceptional 51.9% |
| Paraguayans | 99.8 /100 | #57 | Exceptional 51.8% |
| New Zealanders | 99.8 /100 | #58 | Exceptional 51.8% |
| Immigrants | Serbia | 99.8 /100 | #59 | Exceptional 51.7% |
| Immigrants | Bolivia | 99.7 /100 | #60 | Exceptional 51.5% |
| Immigrants | Kazakhstan | 99.7 /100 | #61 | Exceptional 51.4% |
| Bhutanese | 99.7 /100 | #62 | Exceptional 51.4% |
| South Africans | 99.7 /100 | #63 | Exceptional 51.4% |
| Immigrants | Netherlands | 99.7 /100 | #64 | Exceptional 51.4% |