Immigrants from Singapore vs Paraguayan Self-Care Disability
COMPARE
Immigrants from Singapore
Paraguayan
Self-Care Disability
Self-Care Disability Comparison
Immigrants from Singapore
Paraguayans
2.1%
SELF-CARE DISABILITY
100.0/ 100
METRIC RATING
4th/ 347
METRIC RANK
2.3%
SELF-CARE DISABILITY
99.9/ 100
METRIC RATING
30th/ 347
METRIC RANK
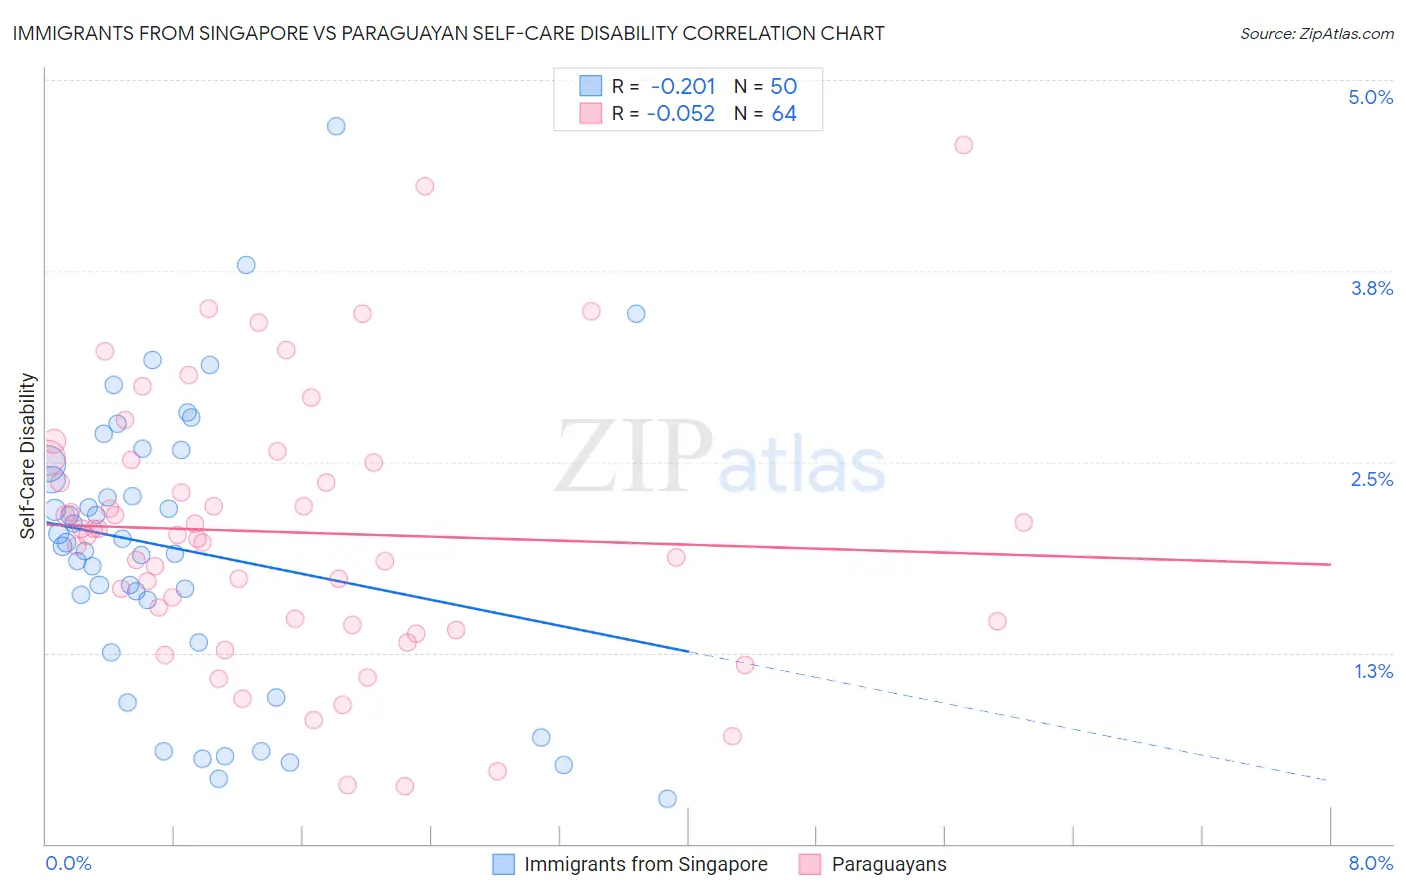
Immigrants from Singapore vs Paraguayan Self-Care Disability Correlation Chart
The statistical analysis conducted on geographies consisting of 137,406,292 people shows a weak negative correlation between the proportion of Immigrants from Singapore and percentage of population with self-care disability in the United States with a correlation coefficient (R) of -0.201 and weighted average of 2.1%. Similarly, the statistical analysis conducted on geographies consisting of 95,092,282 people shows a slight negative correlation between the proportion of Paraguayans and percentage of population with self-care disability in the United States with a correlation coefficient (R) of -0.052 and weighted average of 2.3%, a difference of 6.0%.
Self-Care Disability Correlation Summary
| Measurement | Immigrants from Singapore | Paraguayan |
| Minimum | 0.30% | 0.38% |
| Maximum | 4.7% | 4.6% |
| Range | 4.4% | 4.2% |
| Mean | 1.9% | 2.0% |
| Median | 2.0% | 2.0% |
| Interquartile 25% (IQ1) | 1.3% | 1.4% |
| Interquartile 75% (IQ3) | 2.5% | 2.5% |
| Interquartile Range (IQR) | 1.2% | 1.1% |
| Standard Deviation (Sample) | 0.94% | 0.88% |
| Standard Deviation (Population) | 0.93% | 0.87% |
Similar Demographics by Self-Care Disability
Demographics Similar to Immigrants from Singapore by Self-Care Disability
In terms of self-care disability, the demographic groups most similar to Immigrants from Singapore are Zimbabwean (2.2%, a difference of 0.98%), Filipino (2.2%, a difference of 1.2%), Immigrants from Bolivia (2.2%, a difference of 1.4%), Bolivian (2.2%, a difference of 1.5%), and Immigrants from Nepal (2.2%, a difference of 1.6%).
| Demographics | Rating | Rank | Self-Care Disability |
| Yup'ik | 100.0 /100 | #1 | Exceptional 1.9% |
| Immigrants | India | 100.0 /100 | #2 | Exceptional 2.0% |
| Thais | 100.0 /100 | #3 | Exceptional 2.1% |
| Immigrants | Singapore | 100.0 /100 | #4 | Exceptional 2.1% |
| Zimbabweans | 100.0 /100 | #5 | Exceptional 2.2% |
| Filipinos | 100.0 /100 | #6 | Exceptional 2.2% |
| Immigrants | Bolivia | 100.0 /100 | #7 | Exceptional 2.2% |
| Bolivians | 100.0 /100 | #8 | Exceptional 2.2% |
| Immigrants | Nepal | 100.0 /100 | #9 | Exceptional 2.2% |
| Sudanese | 100.0 /100 | #10 | Exceptional 2.2% |
| Immigrants | South Central Asia | 100.0 /100 | #11 | Exceptional 2.2% |
| Immigrants | Ethiopia | 100.0 /100 | #12 | Exceptional 2.2% |
| Ethiopians | 100.0 /100 | #13 | Exceptional 2.2% |
| Luxembourgers | 100.0 /100 | #14 | Exceptional 2.2% |
| Okinawans | 100.0 /100 | #15 | Exceptional 2.2% |
Demographics Similar to Paraguayans by Self-Care Disability
In terms of self-care disability, the demographic groups most similar to Paraguayans are Danish (2.3%, a difference of 0.010%), Burmese (2.3%, a difference of 0.080%), Immigrants from Korea (2.3%, a difference of 0.31%), Immigrants from Zimbabwe (2.3%, a difference of 0.33%), and Immigrants from Turkey (2.3%, a difference of 0.37%).
| Demographics | Rating | Rank | Self-Care Disability |
| Cambodians | 100.0 /100 | #23 | Exceptional 2.2% |
| Cypriots | 100.0 /100 | #24 | Exceptional 2.2% |
| Turks | 100.0 /100 | #25 | Exceptional 2.2% |
| Immigrants | Sri Lanka | 99.9 /100 | #26 | Exceptional 2.2% |
| Venezuelans | 99.9 /100 | #27 | Exceptional 2.2% |
| Inupiat | 99.9 /100 | #28 | Exceptional 2.2% |
| Immigrants | Zimbabwe | 99.9 /100 | #29 | Exceptional 2.3% |
| Paraguayans | 99.9 /100 | #30 | Exceptional 2.3% |
| Danes | 99.9 /100 | #31 | Exceptional 2.3% |
| Burmese | 99.9 /100 | #32 | Exceptional 2.3% |
| Immigrants | Korea | 99.9 /100 | #33 | Exceptional 2.3% |
| Immigrants | Turkey | 99.9 /100 | #34 | Exceptional 2.3% |
| Immigrants | Australia | 99.9 /100 | #35 | Exceptional 2.3% |
| Immigrants | Lithuania | 99.9 /100 | #36 | Exceptional 2.3% |
| Immigrants | Sweden | 99.9 /100 | #37 | Exceptional 2.3% |