Yakama vs White/Caucasian Hearing Disability
COMPARE
Yakama
White/Caucasian
Hearing Disability
Hearing Disability Comparison
Yakama
Whites/Caucasians
3.9%
HEARING DISABILITY
0.0/ 100
METRIC RATING
314th/ 347
METRIC RANK
3.7%
HEARING DISABILITY
0.0/ 100
METRIC RATING
290th/ 347
METRIC RANK
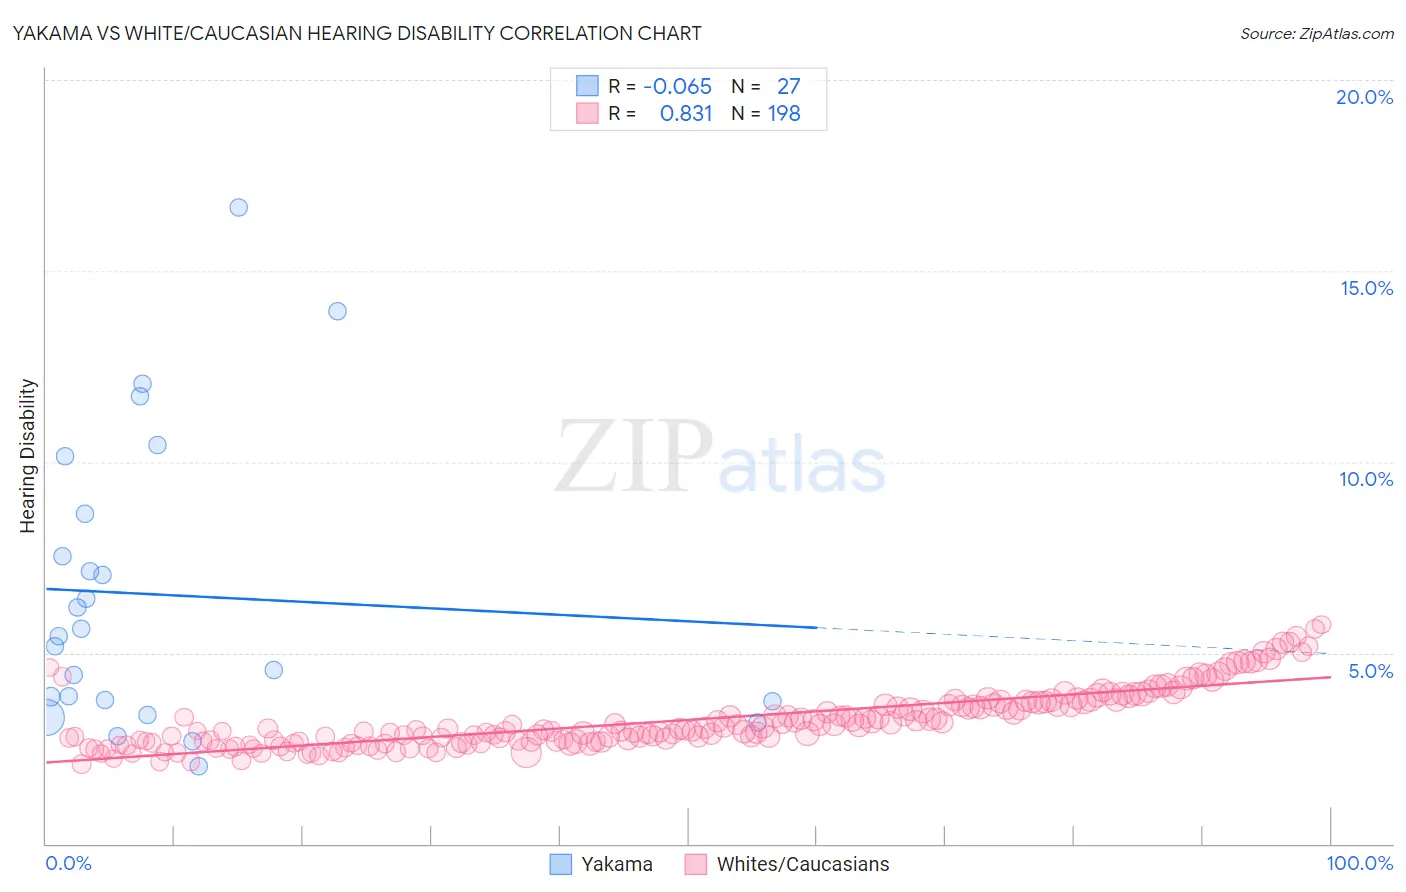
Yakama vs White/Caucasian Hearing Disability Correlation Chart
The statistical analysis conducted on geographies consisting of 19,917,800 people shows a slight negative correlation between the proportion of Yakama and percentage of population with hearing disability in the United States with a correlation coefficient (R) of -0.065 and weighted average of 3.9%. Similarly, the statistical analysis conducted on geographies consisting of 582,250,050 people shows a very strong positive correlation between the proportion of Whites/Caucasians and percentage of population with hearing disability in the United States with a correlation coefficient (R) of 0.831 and weighted average of 3.7%, a difference of 7.1%.
Hearing Disability Correlation Summary
| Measurement | Yakama | White/Caucasian |
| Minimum | 2.0% | 2.1% |
| Maximum | 16.7% | 5.7% |
| Range | 14.6% | 3.6% |
| Mean | 6.5% | 3.2% |
| Median | 5.4% | 3.0% |
| Interquartile 25% (IQ1) | 3.7% | 2.7% |
| Interquartile 75% (IQ3) | 8.6% | 3.7% |
| Interquartile Range (IQR) | 4.9% | 1.0% |
| Standard Deviation (Sample) | 3.8% | 0.77% |
| Standard Deviation (Population) | 3.7% | 0.77% |
Similar Demographics by Hearing Disability
Demographics Similar to Yakama by Hearing Disability
In terms of hearing disability, the demographic groups most similar to Yakama are Puget Sound Salish (3.9%, a difference of 0.010%), Hopi (3.9%, a difference of 0.17%), Spanish American (4.0%, a difference of 0.21%), Cajun (3.9%, a difference of 0.28%), and Comanche (4.0%, a difference of 0.34%).
| Demographics | Rating | Rank | Hearing Disability |
| French Canadians | 0.0 /100 | #307 | Tragic 3.8% |
| Ottawa | 0.0 /100 | #308 | Tragic 3.8% |
| Scotch-Irish | 0.0 /100 | #309 | Tragic 3.8% |
| Cree | 0.0 /100 | #310 | Tragic 3.8% |
| Americans | 0.0 /100 | #311 | Tragic 3.9% |
| Cajuns | 0.0 /100 | #312 | Tragic 3.9% |
| Hopi | 0.0 /100 | #313 | Tragic 3.9% |
| Yakama | 0.0 /100 | #314 | Tragic 3.9% |
| Puget Sound Salish | 0.0 /100 | #315 | Tragic 3.9% |
| Spanish Americans | 0.0 /100 | #316 | Tragic 4.0% |
| Comanche | 0.0 /100 | #317 | Tragic 4.0% |
| Cheyenne | 0.0 /100 | #318 | Tragic 4.0% |
| Chippewa | 0.0 /100 | #319 | Tragic 4.0% |
| Shoshone | 0.0 /100 | #320 | Tragic 4.0% |
| Paiute | 0.0 /100 | #321 | Tragic 4.1% |
Demographics Similar to Whites/Caucasians by Hearing Disability
In terms of hearing disability, the demographic groups most similar to Whites/Caucasians are Finnish (3.7%, a difference of 0.010%), Native Hawaiian (3.7%, a difference of 0.080%), Chinese (3.7%, a difference of 0.13%), Norwegian (3.7%, a difference of 0.13%), and Irish (3.7%, a difference of 0.34%).
| Demographics | Rating | Rank | Hearing Disability |
| Blackfeet | 0.0 /100 | #283 | Tragic 3.6% |
| Immigrants | Micronesia | 0.0 /100 | #284 | Tragic 3.6% |
| Sioux | 0.0 /100 | #285 | Tragic 3.6% |
| Delaware | 0.0 /100 | #286 | Tragic 3.6% |
| Spanish | 0.0 /100 | #287 | Tragic 3.7% |
| Irish | 0.0 /100 | #288 | Tragic 3.7% |
| Chinese | 0.0 /100 | #289 | Tragic 3.7% |
| Whites/Caucasians | 0.0 /100 | #290 | Tragic 3.7% |
| Finns | 0.0 /100 | #291 | Tragic 3.7% |
| Native Hawaiians | 0.0 /100 | #292 | Tragic 3.7% |
| Norwegians | 0.0 /100 | #293 | Tragic 3.7% |
| Iroquois | 0.0 /100 | #294 | Tragic 3.7% |
| Welsh | 0.0 /100 | #295 | Tragic 3.7% |
| Pima | 0.0 /100 | #296 | Tragic 3.7% |
| Immigrants | Azores | 0.0 /100 | #297 | Tragic 3.7% |