Yakama vs Fijian Hearing Disability
COMPARE
Yakama
Fijian
Hearing Disability
Hearing Disability Comparison
Yakama
Fijians
3.9%
HEARING DISABILITY
0.0/ 100
METRIC RATING
314th/ 347
METRIC RANK
3.5%
HEARING DISABILITY
0.0/ 100
METRIC RATING
272nd/ 347
METRIC RANK
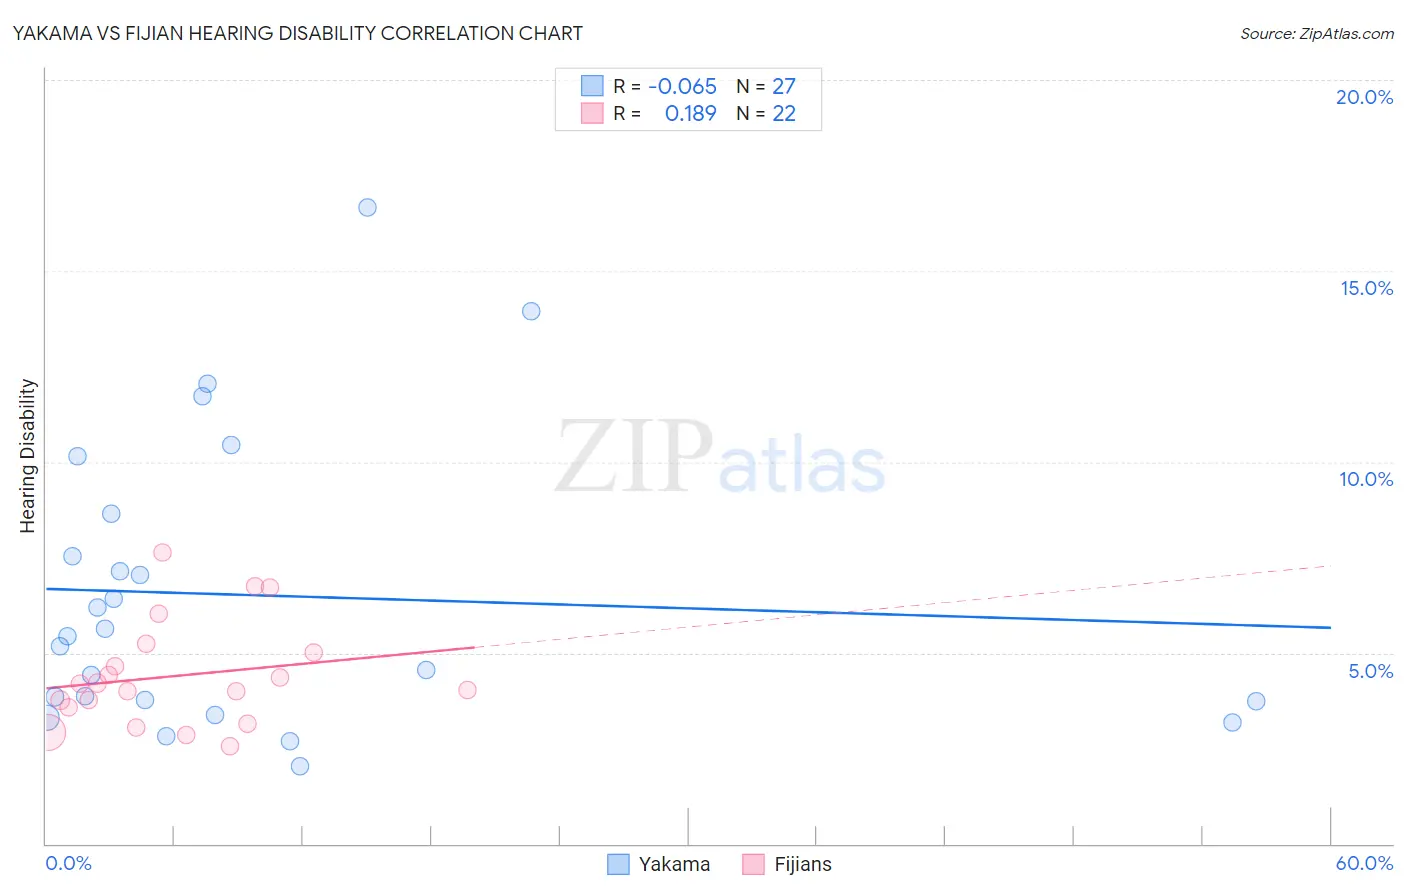
Yakama vs Fijian Hearing Disability Correlation Chart
The statistical analysis conducted on geographies consisting of 19,917,800 people shows a slight negative correlation between the proportion of Yakama and percentage of population with hearing disability in the United States with a correlation coefficient (R) of -0.065 and weighted average of 3.9%. Similarly, the statistical analysis conducted on geographies consisting of 55,946,313 people shows a poor positive correlation between the proportion of Fijians and percentage of population with hearing disability in the United States with a correlation coefficient (R) of 0.189 and weighted average of 3.5%, a difference of 11.8%.
Hearing Disability Correlation Summary
| Measurement | Yakama | Fijian |
| Minimum | 2.0% | 2.5% |
| Maximum | 16.7% | 7.6% |
| Range | 14.6% | 5.1% |
| Mean | 6.5% | 4.4% |
| Median | 5.4% | 4.1% |
| Interquartile 25% (IQ1) | 3.7% | 3.6% |
| Interquartile 75% (IQ3) | 8.6% | 5.0% |
| Interquartile Range (IQR) | 4.9% | 1.4% |
| Standard Deviation (Sample) | 3.8% | 1.4% |
| Standard Deviation (Population) | 3.7% | 1.3% |
Similar Demographics by Hearing Disability
Demographics Similar to Yakama by Hearing Disability
In terms of hearing disability, the demographic groups most similar to Yakama are Puget Sound Salish (3.9%, a difference of 0.010%), Hopi (3.9%, a difference of 0.17%), Spanish American (4.0%, a difference of 0.21%), Cajun (3.9%, a difference of 0.28%), and Comanche (4.0%, a difference of 0.34%).
| Demographics | Rating | Rank | Hearing Disability |
| French Canadians | 0.0 /100 | #307 | Tragic 3.8% |
| Ottawa | 0.0 /100 | #308 | Tragic 3.8% |
| Scotch-Irish | 0.0 /100 | #309 | Tragic 3.8% |
| Cree | 0.0 /100 | #310 | Tragic 3.8% |
| Americans | 0.0 /100 | #311 | Tragic 3.9% |
| Cajuns | 0.0 /100 | #312 | Tragic 3.9% |
| Hopi | 0.0 /100 | #313 | Tragic 3.9% |
| Yakama | 0.0 /100 | #314 | Tragic 3.9% |
| Puget Sound Salish | 0.0 /100 | #315 | Tragic 3.9% |
| Spanish Americans | 0.0 /100 | #316 | Tragic 4.0% |
| Comanche | 0.0 /100 | #317 | Tragic 4.0% |
| Cheyenne | 0.0 /100 | #318 | Tragic 4.0% |
| Chippewa | 0.0 /100 | #319 | Tragic 4.0% |
| Shoshone | 0.0 /100 | #320 | Tragic 4.0% |
| Paiute | 0.0 /100 | #321 | Tragic 4.1% |
Demographics Similar to Fijians by Hearing Disability
In terms of hearing disability, the demographic groups most similar to Fijians are Puerto Rican (3.5%, a difference of 0.070%), Czech (3.5%, a difference of 0.26%), Swiss (3.5%, a difference of 0.39%), European (3.5%, a difference of 0.52%), and Czechoslovakian (3.6%, a difference of 0.60%).
| Demographics | Rating | Rank | Hearing Disability |
| British | 0.1 /100 | #265 | Tragic 3.5% |
| Belgians | 0.1 /100 | #266 | Tragic 3.5% |
| Canadians | 0.1 /100 | #267 | Tragic 3.5% |
| Spaniards | 0.1 /100 | #268 | Tragic 3.5% |
| Ute | 0.1 /100 | #269 | Tragic 3.5% |
| Europeans | 0.1 /100 | #270 | Tragic 3.5% |
| Czechs | 0.1 /100 | #271 | Tragic 3.5% |
| Fijians | 0.0 /100 | #272 | Tragic 3.5% |
| Puerto Ricans | 0.0 /100 | #273 | Tragic 3.5% |
| Swiss | 0.0 /100 | #274 | Tragic 3.5% |
| Czechoslovakians | 0.0 /100 | #275 | Tragic 3.6% |
| Danes | 0.0 /100 | #276 | Tragic 3.6% |
| Immigrants | Nonimmigrants | 0.0 /100 | #277 | Tragic 3.6% |
| Basques | 0.0 /100 | #278 | Tragic 3.6% |
| Slovaks | 0.0 /100 | #279 | Tragic 3.6% |