Korean vs White/Caucasian Hearing Disability
COMPARE
Korean
White/Caucasian
Hearing Disability
Hearing Disability Comparison
Koreans
Whites/Caucasians
3.1%
HEARING DISABILITY
27.6/ 100
METRIC RATING
192nd/ 347
METRIC RANK
3.7%
HEARING DISABILITY
0.0/ 100
METRIC RATING
290th/ 347
METRIC RANK
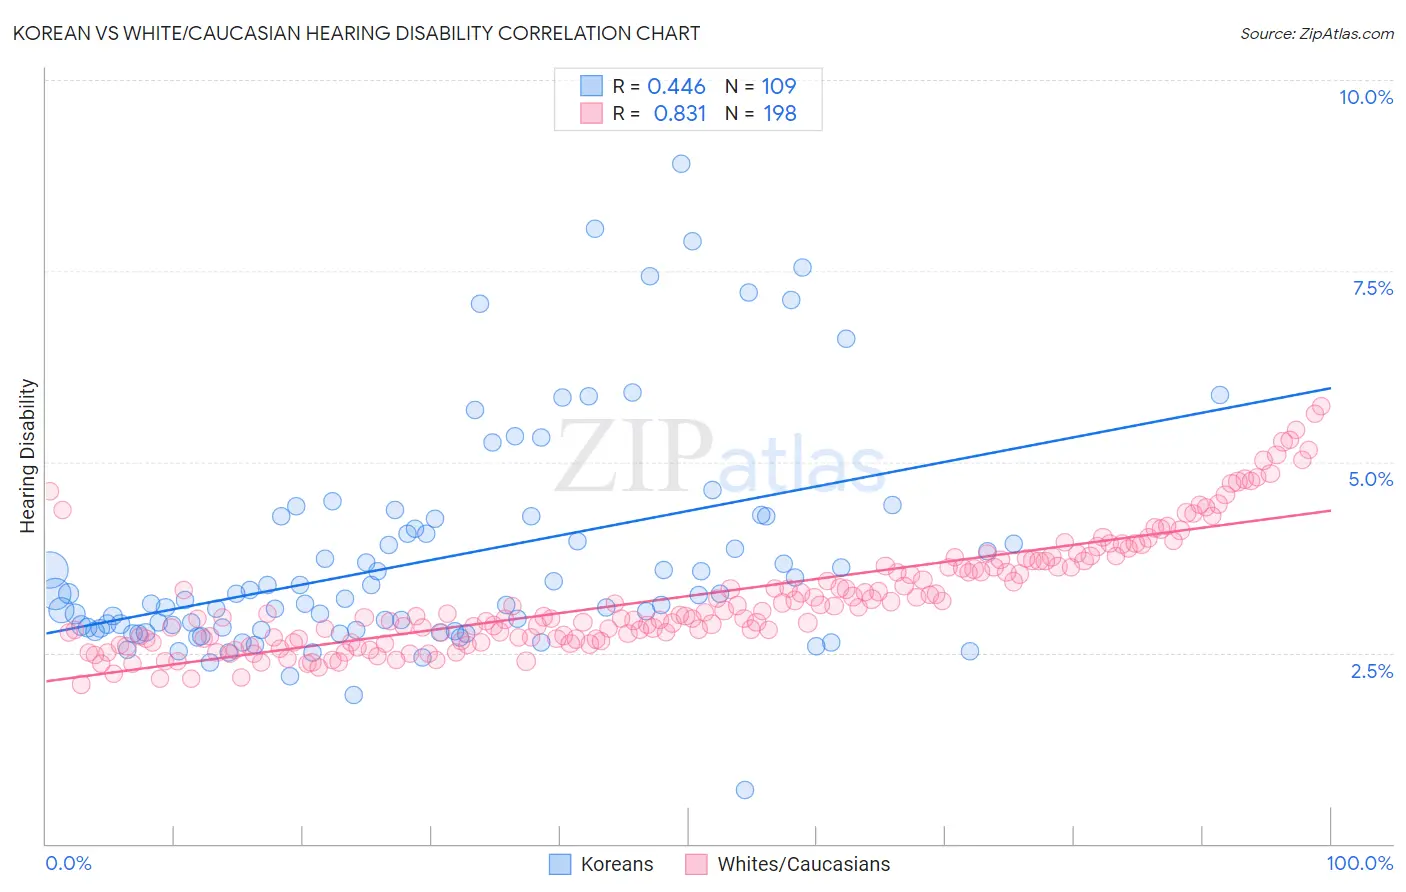
Korean vs White/Caucasian Hearing Disability Correlation Chart
The statistical analysis conducted on geographies consisting of 510,543,353 people shows a moderate positive correlation between the proportion of Koreans and percentage of population with hearing disability in the United States with a correlation coefficient (R) of 0.446 and weighted average of 3.1%. Similarly, the statistical analysis conducted on geographies consisting of 582,250,050 people shows a very strong positive correlation between the proportion of Whites/Caucasians and percentage of population with hearing disability in the United States with a correlation coefficient (R) of 0.831 and weighted average of 3.7%, a difference of 20.3%.
Hearing Disability Correlation Summary
| Measurement | Korean | White/Caucasian |
| Minimum | 0.70% | 2.1% |
| Maximum | 8.9% | 5.7% |
| Range | 8.2% | 3.6% |
| Mean | 3.7% | 3.2% |
| Median | 3.2% | 3.0% |
| Interquartile 25% (IQ1) | 2.8% | 2.7% |
| Interquartile 75% (IQ3) | 4.2% | 3.7% |
| Interquartile Range (IQR) | 1.4% | 1.0% |
| Standard Deviation (Sample) | 1.5% | 0.77% |
| Standard Deviation (Population) | 1.5% | 0.77% |
Similar Demographics by Hearing Disability
Demographics Similar to Koreans by Hearing Disability
In terms of hearing disability, the demographic groups most similar to Koreans are Macedonian (3.1%, a difference of 0.080%), Immigrants from Switzerland (3.1%, a difference of 0.13%), South African (3.1%, a difference of 0.37%), Immigrants from South Africa (3.1%, a difference of 0.38%), and Spanish American Indian (3.1%, a difference of 0.42%).
| Demographics | Rating | Rank | Hearing Disability |
| Immigrants | Southern Europe | 35.3 /100 | #185 | Fair 3.0% |
| Immigrants | Mexico | 34.9 /100 | #186 | Fair 3.0% |
| Blacks/African Americans | 34.7 /100 | #187 | Fair 3.0% |
| Mexican American Indians | 34.7 /100 | #188 | Fair 3.0% |
| Africans | 32.9 /100 | #189 | Fair 3.0% |
| Immigrants | South Africa | 31.1 /100 | #190 | Fair 3.1% |
| Immigrants | Switzerland | 28.8 /100 | #191 | Fair 3.1% |
| Koreans | 27.6 /100 | #192 | Fair 3.1% |
| Macedonians | 27.0 /100 | #193 | Fair 3.1% |
| South Africans | 24.5 /100 | #194 | Fair 3.1% |
| Spanish American Indians | 24.1 /100 | #195 | Fair 3.1% |
| Immigrants | Europe | 22.9 /100 | #196 | Fair 3.1% |
| Immigrants | Bosnia and Herzegovina | 20.6 /100 | #197 | Fair 3.1% |
| Immigrants | Croatia | 20.5 /100 | #198 | Fair 3.1% |
| Syrians | 19.2 /100 | #199 | Poor 3.1% |
Demographics Similar to Whites/Caucasians by Hearing Disability
In terms of hearing disability, the demographic groups most similar to Whites/Caucasians are Finnish (3.7%, a difference of 0.010%), Native Hawaiian (3.7%, a difference of 0.080%), Chinese (3.7%, a difference of 0.13%), Norwegian (3.7%, a difference of 0.13%), and Irish (3.7%, a difference of 0.34%).
| Demographics | Rating | Rank | Hearing Disability |
| Blackfeet | 0.0 /100 | #283 | Tragic 3.6% |
| Immigrants | Micronesia | 0.0 /100 | #284 | Tragic 3.6% |
| Sioux | 0.0 /100 | #285 | Tragic 3.6% |
| Delaware | 0.0 /100 | #286 | Tragic 3.6% |
| Spanish | 0.0 /100 | #287 | Tragic 3.7% |
| Irish | 0.0 /100 | #288 | Tragic 3.7% |
| Chinese | 0.0 /100 | #289 | Tragic 3.7% |
| Whites/Caucasians | 0.0 /100 | #290 | Tragic 3.7% |
| Finns | 0.0 /100 | #291 | Tragic 3.7% |
| Native Hawaiians | 0.0 /100 | #292 | Tragic 3.7% |
| Norwegians | 0.0 /100 | #293 | Tragic 3.7% |
| Iroquois | 0.0 /100 | #294 | Tragic 3.7% |
| Welsh | 0.0 /100 | #295 | Tragic 3.7% |
| Pima | 0.0 /100 | #296 | Tragic 3.7% |
| Immigrants | Azores | 0.0 /100 | #297 | Tragic 3.7% |