Costa Rican vs White/Caucasian Hearing Disability
COMPARE
Costa Rican
White/Caucasian
Hearing Disability
Hearing Disability Comparison
Costa Ricans
Whites/Caucasians
2.9%
HEARING DISABILITY
71.4/ 100
METRIC RATING
155th/ 347
METRIC RANK
3.7%
HEARING DISABILITY
0.0/ 100
METRIC RATING
290th/ 347
METRIC RANK
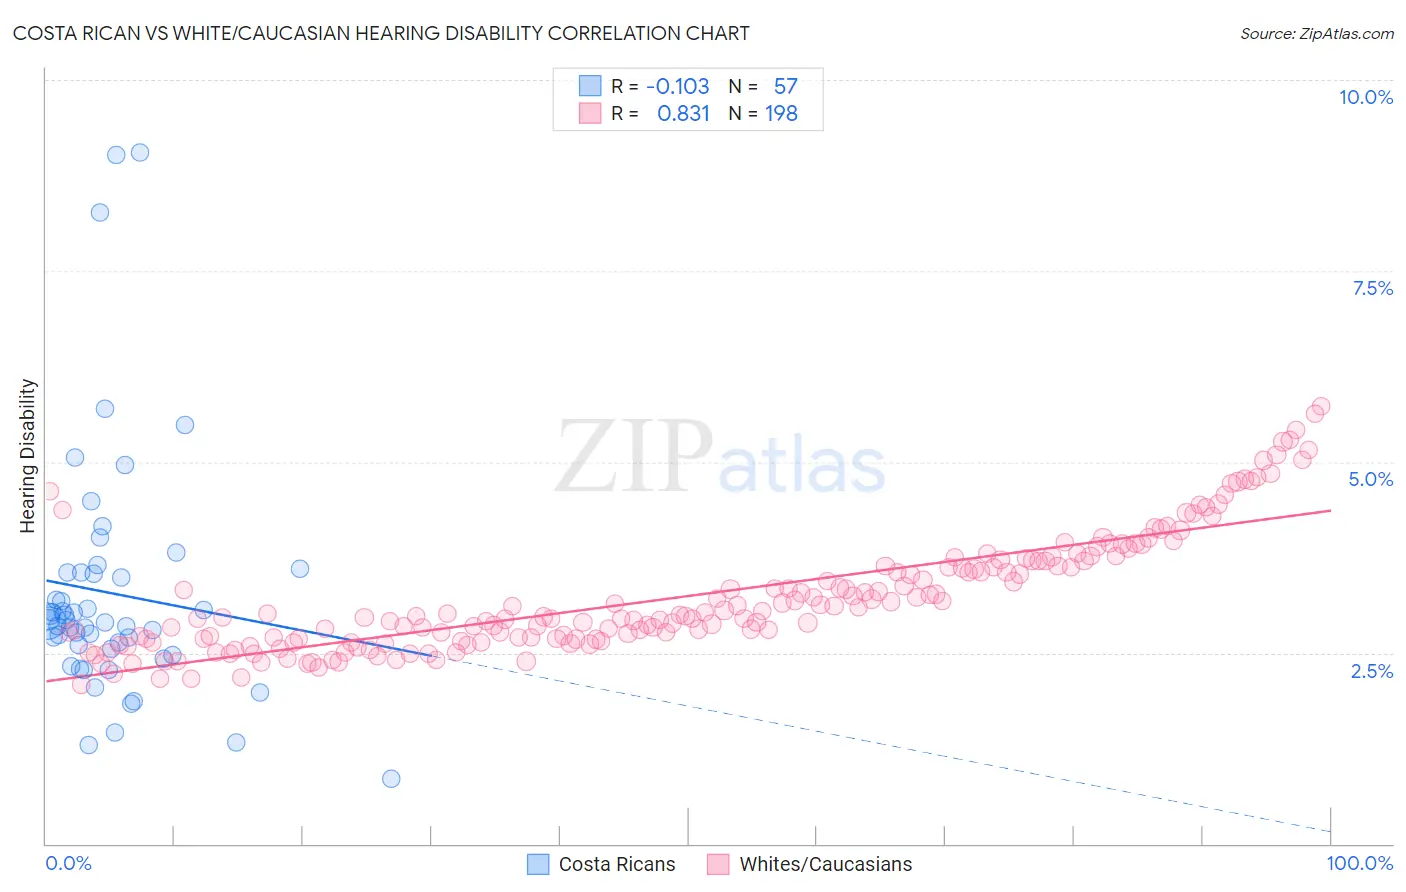
Costa Rican vs White/Caucasian Hearing Disability Correlation Chart
The statistical analysis conducted on geographies consisting of 253,538,538 people shows a poor negative correlation between the proportion of Costa Ricans and percentage of population with hearing disability in the United States with a correlation coefficient (R) of -0.103 and weighted average of 2.9%. Similarly, the statistical analysis conducted on geographies consisting of 582,250,050 people shows a very strong positive correlation between the proportion of Whites/Caucasians and percentage of population with hearing disability in the United States with a correlation coefficient (R) of 0.831 and weighted average of 3.7%, a difference of 25.7%.
Hearing Disability Correlation Summary
| Measurement | Costa Rican | White/Caucasian |
| Minimum | 0.86% | 2.1% |
| Maximum | 9.0% | 5.7% |
| Range | 8.2% | 3.6% |
| Mean | 3.3% | 3.2% |
| Median | 2.9% | 3.0% |
| Interquartile 25% (IQ1) | 2.5% | 2.7% |
| Interquartile 75% (IQ3) | 3.6% | 3.7% |
| Interquartile Range (IQR) | 1.0% | 1.0% |
| Standard Deviation (Sample) | 1.6% | 0.77% |
| Standard Deviation (Population) | 1.6% | 0.77% |
Similar Demographics by Hearing Disability
Demographics Similar to Costa Ricans by Hearing Disability
In terms of hearing disability, the demographic groups most similar to Costa Ricans are Immigrants from Lebanon (2.9%, a difference of 0.010%), Sudanese (2.9%, a difference of 0.090%), Immigrants from Poland (2.9%, a difference of 0.14%), Immigrants from Lithuania (2.9%, a difference of 0.19%), and Immigrants from France (2.9%, a difference of 0.21%).
| Demographics | Rating | Rank | Hearing Disability |
| Immigrants | Russia | 77.7 /100 | #148 | Good 2.9% |
| Immigrants | Panama | 76.9 /100 | #149 | Good 2.9% |
| Palestinians | 73.6 /100 | #150 | Good 2.9% |
| Immigrants | France | 73.1 /100 | #151 | Good 2.9% |
| Immigrants | Lithuania | 73.0 /100 | #152 | Good 2.9% |
| Sudanese | 72.1 /100 | #153 | Good 2.9% |
| Immigrants | Lebanon | 71.5 /100 | #154 | Good 2.9% |
| Costa Ricans | 71.4 /100 | #155 | Good 2.9% |
| Immigrants | Poland | 70.2 /100 | #156 | Good 2.9% |
| Immigrants | Kazakhstan | 69.6 /100 | #157 | Good 2.9% |
| Immigrants | Burma/Myanmar | 69.5 /100 | #158 | Good 2.9% |
| Immigrants | Australia | 67.4 /100 | #159 | Good 2.9% |
| Immigrants | Fiji | 67.1 /100 | #160 | Good 2.9% |
| Albanians | 66.6 /100 | #161 | Good 2.9% |
| Immigrants | Japan | 66.3 /100 | #162 | Good 2.9% |
Demographics Similar to Whites/Caucasians by Hearing Disability
In terms of hearing disability, the demographic groups most similar to Whites/Caucasians are Finnish (3.7%, a difference of 0.010%), Native Hawaiian (3.7%, a difference of 0.080%), Chinese (3.7%, a difference of 0.13%), Norwegian (3.7%, a difference of 0.13%), and Irish (3.7%, a difference of 0.34%).
| Demographics | Rating | Rank | Hearing Disability |
| Blackfeet | 0.0 /100 | #283 | Tragic 3.6% |
| Immigrants | Micronesia | 0.0 /100 | #284 | Tragic 3.6% |
| Sioux | 0.0 /100 | #285 | Tragic 3.6% |
| Delaware | 0.0 /100 | #286 | Tragic 3.6% |
| Spanish | 0.0 /100 | #287 | Tragic 3.7% |
| Irish | 0.0 /100 | #288 | Tragic 3.7% |
| Chinese | 0.0 /100 | #289 | Tragic 3.7% |
| Whites/Caucasians | 0.0 /100 | #290 | Tragic 3.7% |
| Finns | 0.0 /100 | #291 | Tragic 3.7% |
| Native Hawaiians | 0.0 /100 | #292 | Tragic 3.7% |
| Norwegians | 0.0 /100 | #293 | Tragic 3.7% |
| Iroquois | 0.0 /100 | #294 | Tragic 3.7% |
| Welsh | 0.0 /100 | #295 | Tragic 3.7% |
| Pima | 0.0 /100 | #296 | Tragic 3.7% |
| Immigrants | Azores | 0.0 /100 | #297 | Tragic 3.7% |